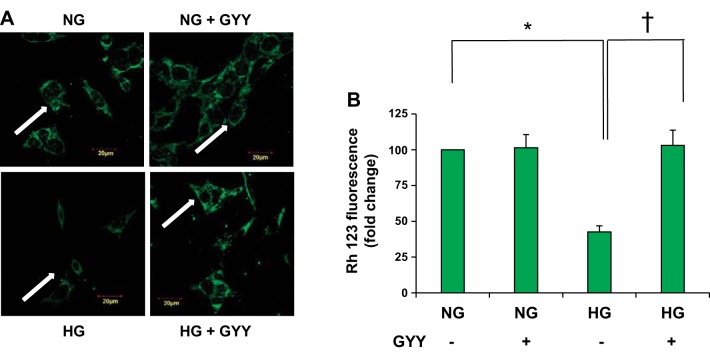
Fig. 7.
Mitochondrial membrane potential. A: Mouse glomerular endothelial cell (MGECs) were incubated with rhodamine 123 (Rh123) to detect the mitochondrial membrane potential. Less green fluorescence intensity indicates decreased membrane potential. B: bar diagram represents intensity of Rh123 fluorescence among the groups. Values are mean ± SE, n = 5/group; *,†P < 0.05. GYY, GYY4137; HG, high glucose; NG, normal glucose.

