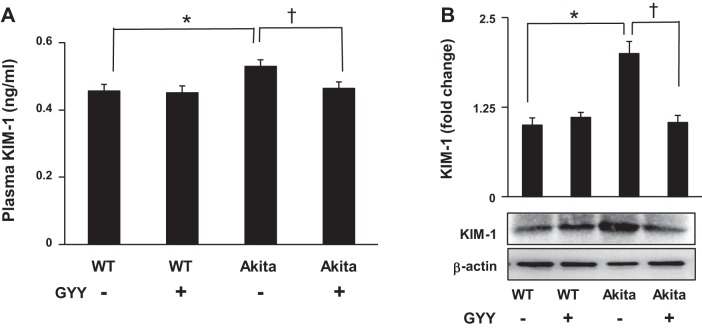
Fig. 9.
Plasma levels and kidney tissue expression of kidney injury molecule-1 (KIM-1). A: plasma levels of KIM-1 were measured by ELISA. Values were obtained against a standard curve. B: KIM-1 immunoblotting of tissue extract from the kidney cortex. Bar diagram represents densitometric analyses of immunoblots. Values are mean ± SE, n = 5/group; *,†P < 0.05. GYY, GYY4137; WT, wild type.

