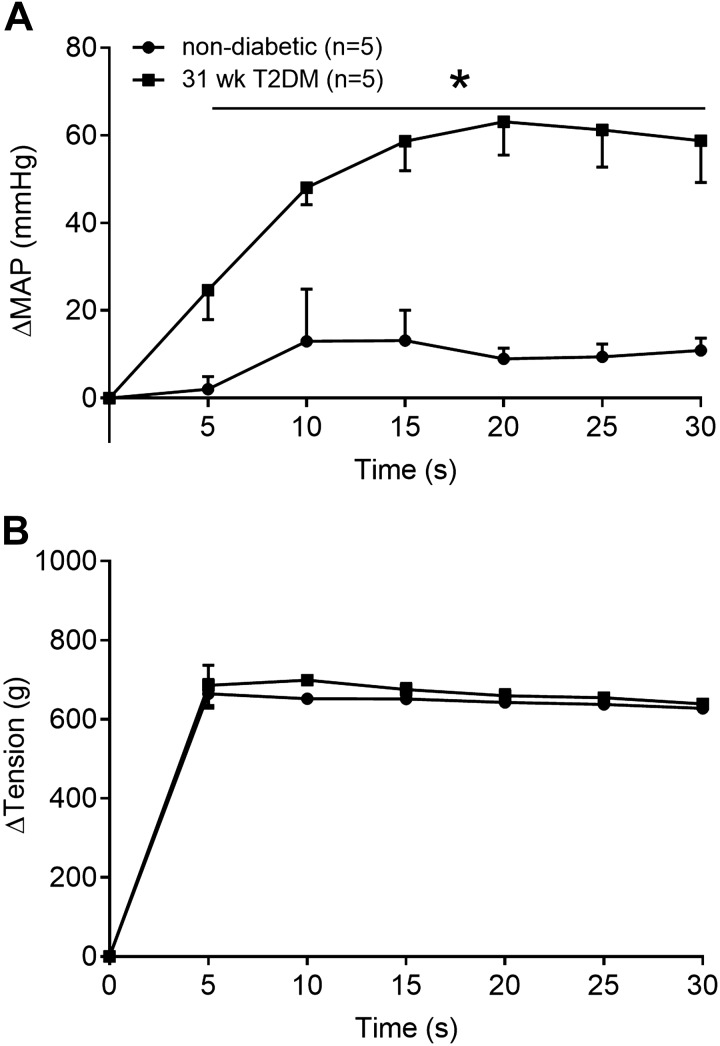
Fig. 3.
The pressor response (A) over 30 s of static stretch in 31-wk type-2 diabetes mellitus (T2DM) (black square, n = 5) and nondiabetic (white circle, n = 5) rats. There was a significant interaction between time and group for change in mean arterial pressure (ΔMAP; P < 0.05). Horizontal black line and *P < 0.05 (2-way ANOVA) indicate significantly greater response compared with nondiabetic rats at each time point. Developed tension (B) was not different between groups at any time point (P > 0.05).

