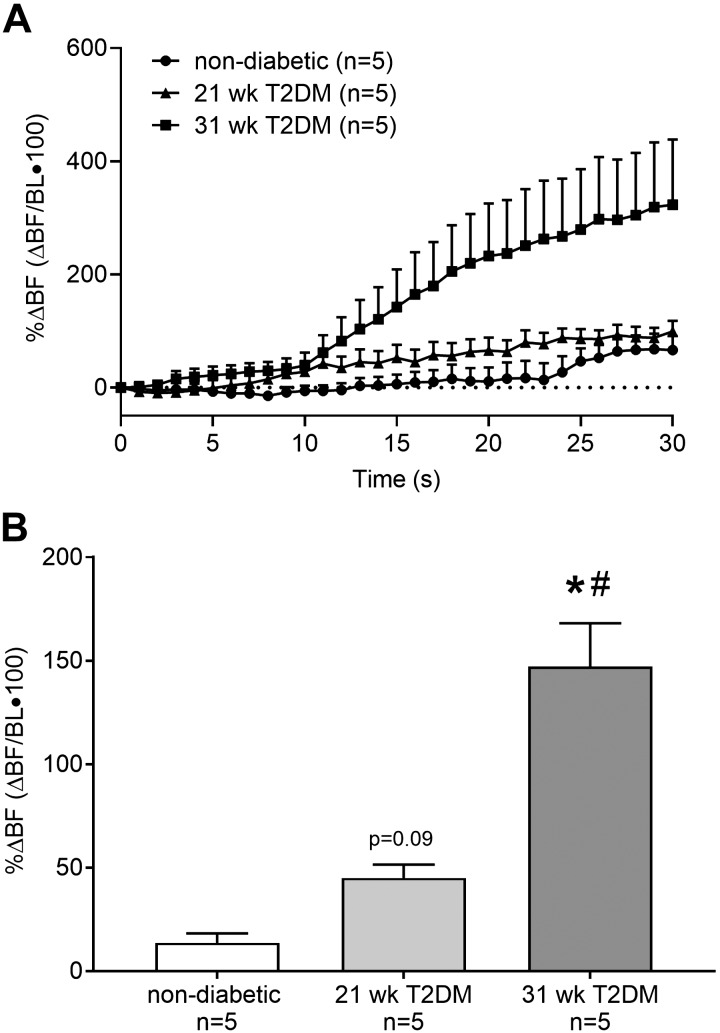
Fig. 4.
The percent change in popliteal arterial blood flow (%ΔBF) from baseline (BL) was averaged second by second to show the temporal changes that occur during 30 s of static contraction (A). Percent change in BF was then averaged over the 30 s of contraction to determine whether mean BF was different between type-2 diabetes mellitus (T2DM) rats and nondiabetic rats (B). Mean BF was greater in the 31-wk (n = 5) compared with 21-wk (n = 5) T2DM rats and nondiabetic rats (n = 5), while it was trending toward being greater in the 21-wk T2DM rats compared with nondiabetic rats. *P < 0.05 (1-way ANOVA) indicates statistically greater percent change in blood flow compared with nondiabetic rats. #P < 0.05 (1-way ANOVA) indicate statistically greater percent change in blood flow compared with 21-wk T2DM rats.

