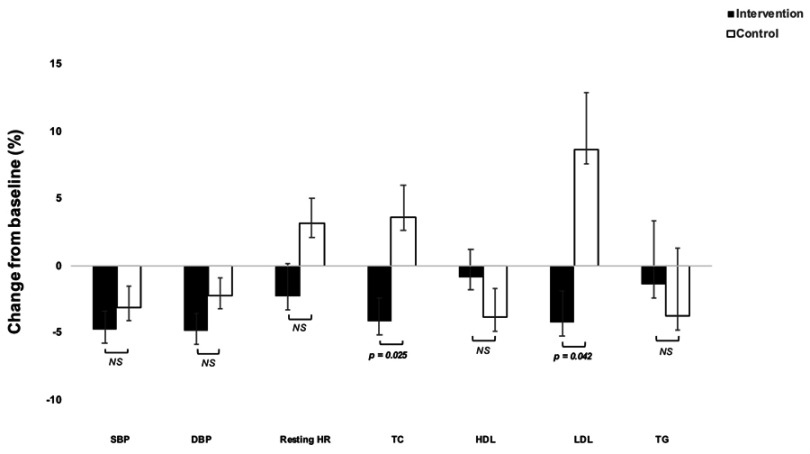
Figure 3.
Mean percentage changes in cardiometabolic risk markers in the study groups following the 10-week intervention period. Error bars represent standard errors of the mean. P-values are derived from ANCOVAs on mean change from baseline to follow-up in percent adjusted for baseline values.
Abbreviations: DBP, diastolic blood pressure; HDL, high-density lipoprotein; HR, heart rate; LDL, low-density lipoprotein; SBP, systolic blood pressure; TC, total cholesterol; TG, triglycerides.

