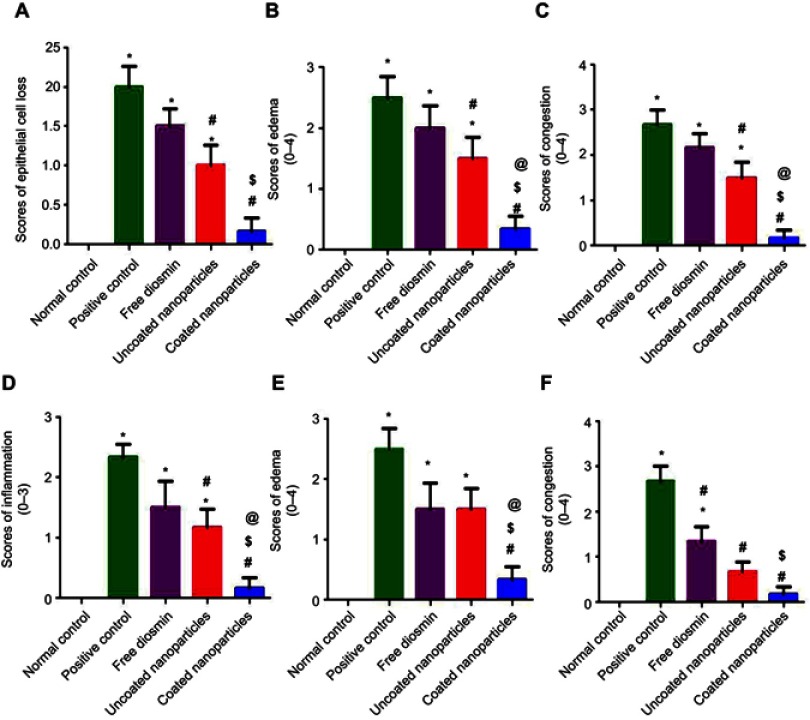
Figure 10.
Statistical analysis of microscopic histopathological scores in gastric mucosa.
Notes: (A–D) Glandular and (E and F) non-glandular mucosa. Data are mean±SD, n=6; statistical differences at P<0.05 considered significant; *vs normal control group; #vs positive control group; $vs diosmin (100 mg/kg) pretreated group; @vs group pretreated with an equivalent dose of uncoated PLGA nanoparticles.
Abbreviation: PLGA, poly(d,l-lactide-co-glycolide).

