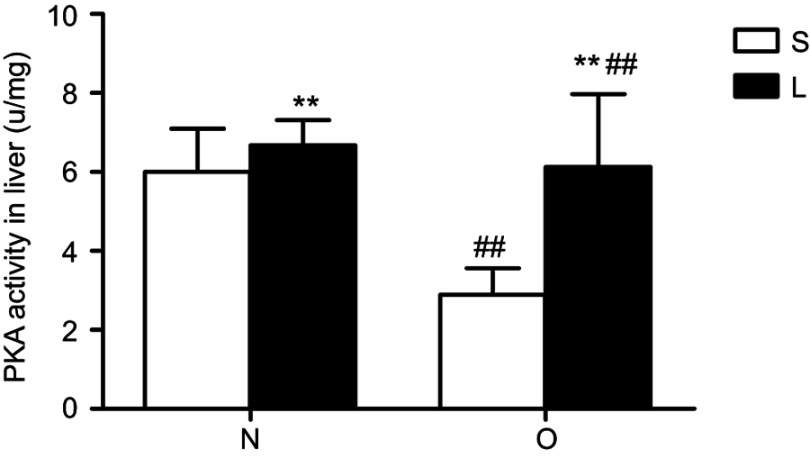
Figure 3.
Protein kinase A (PKA) activity in the liver after treatment with liraglutide. Values are means ± SD (n=6 per group). A 2×2 factorial analysis was used to analyse differences. The p-value of the interaction between obesity and liraglutide treatment in PKA activity is 0.014.
Notes: Between saline and liraglutide, **p<0.01; between normal and obese, ##p<0.01.

