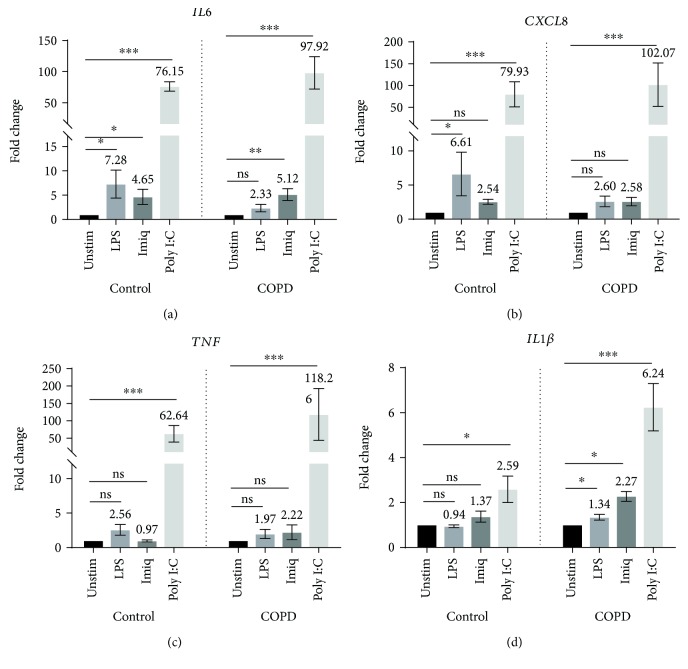
Figure 1.
Expression of mRNA for IL6, CXCL8, TNF, and IL1β by primary AECs in response to virus-like stimuli (imiquimod or poly I:C) and bacterial LPS. AECs from control subjects (n = 7) or COPD patients (n = 7) were stimulated with LPS, imiquimod, or poly I:C. Gene expression data (relative to HPRT) were transformed and analyzed by repeated measures one-way ANOVA. For clarity, graphs show fold change relative to unstimulated cells in the corresponding group (control or COPD). Significant differences relative to unstimulated cells are shown as ∗p < 0.05 and ∗∗∗p < 0.001. Unstim: unstimulated; Imiq: imiquimod.

