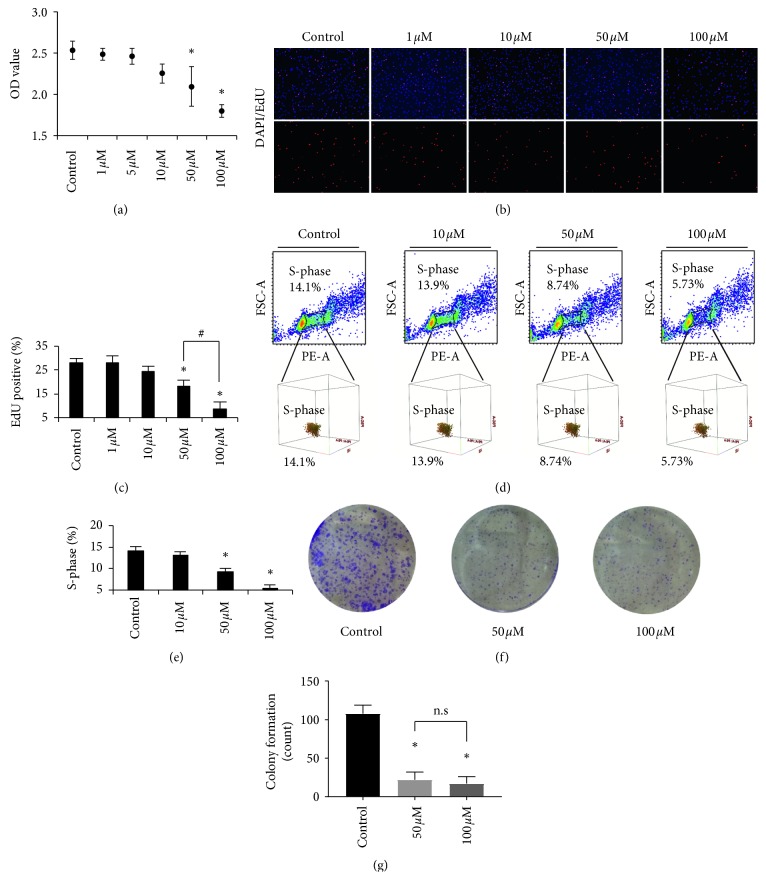
Figure 1.
DHA inhibits cell proliferation of MHCC97-L. (a) Cell viability of MHCC97-L with treatments at the concentration of DHA ranging from 1 to 100 μM. ∗p < 0.05 were accepted as significant difference when compared to control, n = 3. (b, c) DNA synthesis analysis by EdU assay of MHCC97-L with treatments at the concentration of DHA ranging from 1 to 100 μM. ∗p < 0.05 and #p < 0.05 were accepted as significant difference, respectively, when compared to control and 50 μM treatment groups, n = 3. Cell nucleus was stained with DAPI (blue), and EdU showed red. (d, e) Cell cycle analysis of MHCC97-L with treatments at the concentration of DHA, and DNA synthesis phase (S-phase) was counted and statistical comparison was made. ∗p < 0.05 were accepted as significant difference when compared to control, n = 3. (f, g) Colony formation was inhibited by DHA treatments for 12 days. Colonies containing at least 50 cells were counted for statistical comparison. ∗p < 0.05 were accepted as significant difference; n.s. means no significance.

