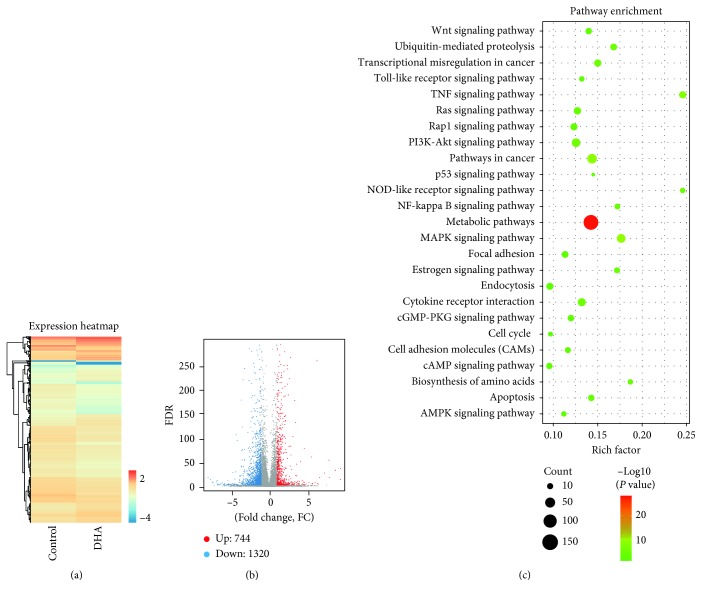
Figure 3.
Global gene expression profiles of MHCC97-L with the treatment of DHA. (a) Heatmap for global gene expression. (b) Volcano map of expression genes. FC (fold change) >1 was accepted as positive differentially expressed genes, up for 744; down for 1320. (c) KEGG pathway enrichment analysis. A larger p value (−log10) indicates a higher degree of enrichment.

