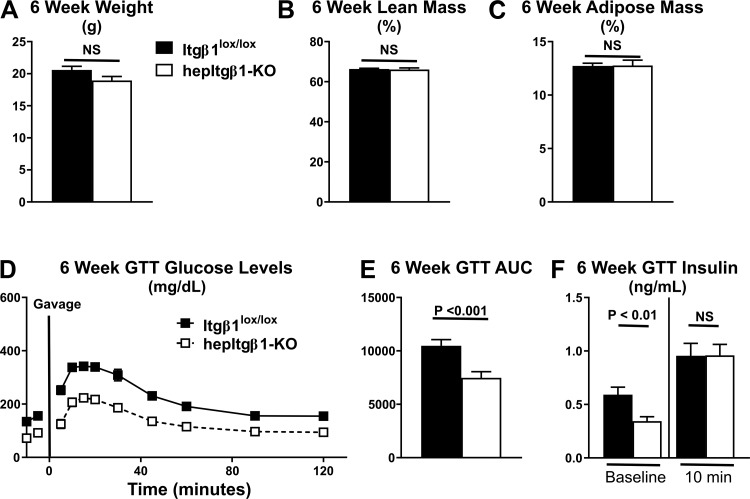
Fig. 11.
A: body weight of Itgβ1lox/lox (n = 17) and hepItgβ1-knockout (KO) (n = 14) mice at 6 wk of age. B: lean mass body composition of Itgβ1lox/lox (n = 17) and hepItgβ1-KO (n = 14) mice at 6 wk of age. C: adipose mass body composition of Itgβ1lox/lox (n = 17) and hepItgβ1-KO (n = 14) mice at 6 wk of age. D: blood glucose levels of 6-wk-old Itgβ1lox/lox (n = 17) and hepItgβ1-KO (n = 14) mice during oral glucose tolerance tests (GTT). E: baseline corrected area under the glucose curves (AUC) of 6-wk-old Itgβ1lox/lox (n = 17) and hepItgβ1-KO (n = 14) mice during oral GTT. F: plasma insulin concentrations of 6-wk-old Itgβ1lox/lox (baseline; n = 17, 10 min; n = 17) and hepItgβ1-KO (baseline; n = 11, 10 min; n = 13) mice during oral GTT. Data are means ± SE. NS, not significant.

