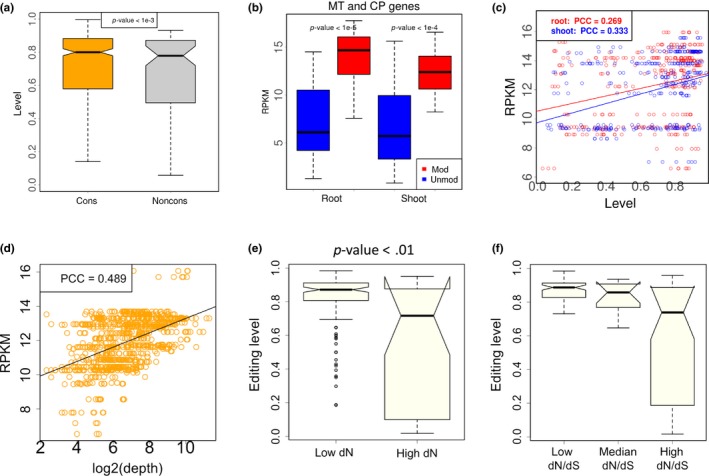
Figure 2.

Levels of C‐to‐U RNA editing in CDS of Arabidopsis thaliana and the correlation with gene expression level. (a) C‐to‐U editing levels of the nonsynonymous editing sites. These editing sites are classified into two categories according to the conservation at DNA level. If the orthologous site in Arabidopsis lyrata is cytidine, then this editing site is conserved (cons). The other editing sites are non conserved (noncons). In this plot, the nonsynonymous editing sites in three biological replicates (roots and shoots) are pooled. p‐value is calculated by Wilcoxon rank sum test. (b) Gene expression levels of the C‐to‐U edited genes and the unedited genes in mitochondria and chloroplast. RPKM (reads per kilobase per million mapped reads) is used to measure the gene expression level. Three biological replicates (roots or shoots) are pooled. MT, mitochondria; CP, chloroplast; mod, modified (edited) genes; unmod, unmodified (unedited) genes. p‐value is calculated by Wilcoxon rank sum test. (c) Pearson's correlation between editing level of each site and the expression level (RPKM) of its host gene. PCC, Pearson's correlation coefficient. (d) Pearson's correlation between sequencing depth (coverage) of each editing site and the expression level (RPKM) of its host gene. (e) Comparison between editing levels in conserved genes (low dN) and non‐conserved genes (high dN). Editing sites are divided into two halves according to the dN values of host genes. p‐value is calculated by Wilcoxon rank sum test. (f) Comparison of editing levels in different categories. Editing sites are divided into three equal bins according to the dN/dS values of host genes
