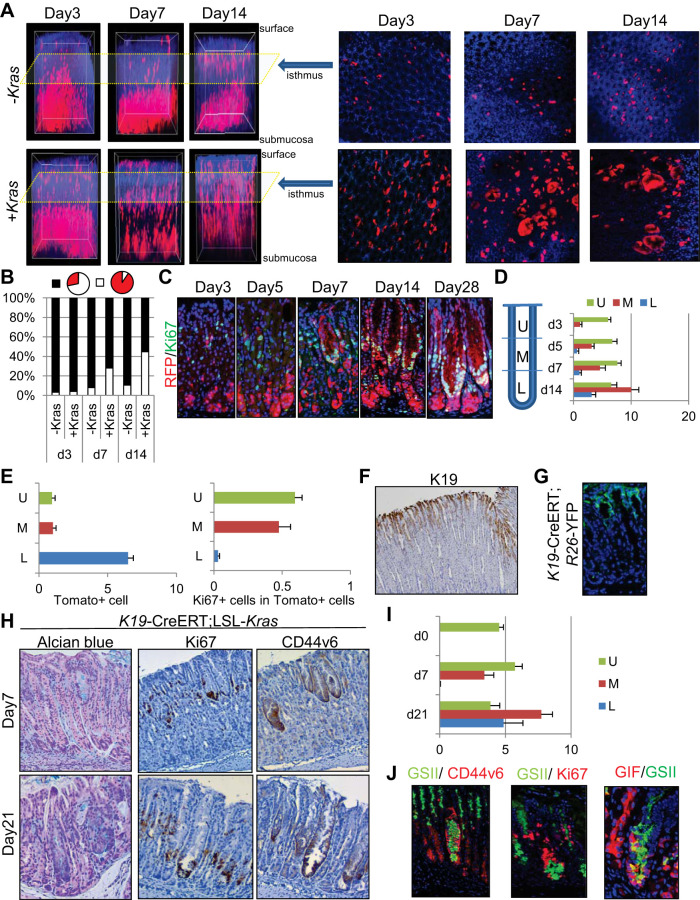
Fig. 7.
Isthmus progenitors are responsible for Kras-induced metaplasia. A: 3D reconstituted (left) and cross-sectional isthmal (right) images of Mist1-CreERT; R26-TdTomato (top) and Mist1-CreERT; LSL-KrasG12D; R26-TdTomato mice at the indicated time points after treatment with 3 mg tamoxifen. B: proportion of glands in which TdTomato+ cells are >50% (white) or <50% (black) at the isthmus level in cross-sectional analysis. C: red fluorescent protein (RFP) (red)/Ki67 (green) staining on Mist1-CreERT; LSL-KrasG12D; R26-TdTomato mouse corpus after treatment with 3 mg tamoxifen. D: average numbers of Ki67+ cells per gland in the upper (U), middle (M), and lower (L) portion of Mist1-CreERT; LSL-KrasG12D; R26-TdTomato mouse corpus glands at the indicated time points. E, left: average numbers of TdTomato+ cells per gland at each portion of Mist1-CreERT; LSL-KrasG12D; R26-TdTomato corpus glands 3 days after treatment with 3 mg tamoxifen. E, right: average numbers of Ki67+ cells in TdTomato+ cells at each portion of Mist1-CreERT; LSL-KrasG12D; R26-TdTomato corpus glands 7 days after tamoxifen treatment. F: K19 immunostaining of mouse corpus. G: green fluorescent protein (GFP) staining (green) on K19-CreERT; R26-YFP mouse corpus 1 day after the administration of 3 mg tamoxifen. H: Alcian blue, Ki67, and CD44v6 staining of K19-CreERT; R26-YFP mouse corpus 7 and 21 days after treatment with 3 mg tamoxifen. I: average numbers of Ki67+ cells per gland in each portion of K19-CreERT; LSL-KrasG12D mouse corpus glands. J, left: GSII (green)/CD44v6 (red). J, middle: GSII (green)/Ki67 (red). J, right: gastric intrinsic factor (GIF) (red)/GSII (green) staining of K19-CreERT; LSL-KrasG12D mouse corpus 21 days after tamoxifen treatment.

