Fig. 5.
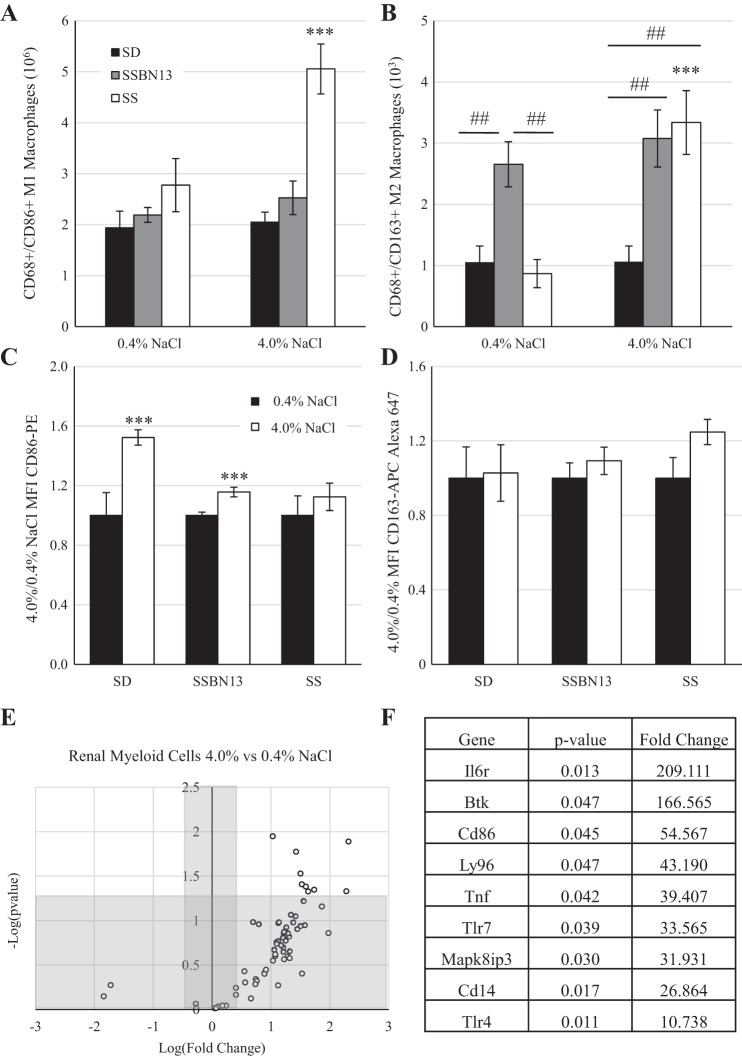
A and B: number of macrophages per kidney of male age-matched Sprague-Dawley (SD), Dahl salt-sensitive (SS), and SSBN13 rats maintained on a 0.4% NaCl diet or fed a 4.0% NaCl diet for 3 wk showing a M1 proinflammatory phenotype (A) or a M2 anti-inflammatory phenotype (B). C and D: ratio of mean fluorescent intensity (MFI) of CD86-PE (C) and CD163-APC (D). E: PCR profiler array of genes relating to Toll-like receptor (TLR) signaling comparing isolated renal myeloid cells from age-matched SS rats fed either a 0.4% or 4.0% NaCl diet for 3 wk as a volcano plot. F: list of genes that were significantly upregulated in 4.0% NaCl diet-fed animals. n = 6 SD, 6 SSBN13, and 6 SS rats on each diet in A–D and n = 6 for each diet in E and F. Two-way ANOVA with a Holm-Sidak post hoc test was used in A–D. ***P < 0.001 vs. the 0.4% NaCl diet within strain; ##P < 0.01 between strains. A Student’s t-test was used in E and F, with a P value cutoff of 0.05 and a fold change cutoff of 2.

