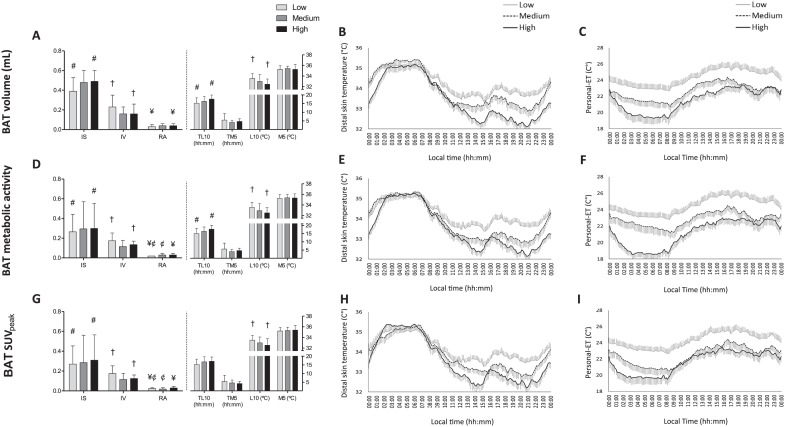
Figure 3.
Distal skin temperature (DST) variables and personal environmental temperature (personal-ET) across tertiles for brown adipose tissue (BAT) volume, metabolic activity, and standardized uptake value (SUV) peak (N = 77). Mann-Whitney tests (exact significance) with Bonferroni correction (all p ≤ 0.0167) were used to compare DST variables across the tertiles for BAT volume (A), metabolic activity (D), and SUVpeak (G). The low, medium, and high tertiles comprised a total of 25, 26, and 26 subjects, respectively. These tertiles were distributed as BAT volume (low: 0-27.06 mL, medium: 27.06-104.07 mL, high: >104.07 mL), metabolic activity (low: 0-90.63, medium: 90.63-474.36, high: >474.36 V), and SUVpeak (low: 0-5.38, medium: 5.38-14.1 V, high: >14.1). Symbols show significant differences across tertiles. Panels B, E, and H show the DST mean daily pattern for the tertiles of BAT volume, metabolic activity, and SUVpeak, respectively. Similarly, panels C, F, and I show the personal-ET mean daily patterns for the tertiles of BAT volume, metabolic activity, and SUVpeak (n = 76). The low, medium, and high tertiles comprised a total of 25, 25, and 26 subjects, respectively. Data are mean ± standard error. IS = interday stability; IV = intraday variability; L10 = mean of the 10 consecutive hours with the lowest values and when they occurred (TL10); M5 = mean of the 5 consecutive hours with the highest values and when they occurred (TM5); RA = relative amplitude.

