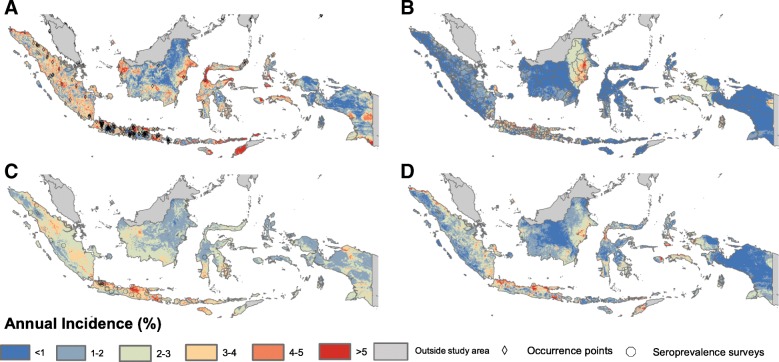
Fig. 3.
The spatial distribution of annual incidence of symptomatic dengue cases in Indonesia as predicted by models fit to the a occurrence data b reported case data, c seroprevalence data and d the mean of an ensemble of each data type. The spatial location of the data points and polygons for each map are also shown. Pearson correlation coefficients between pixels are as follows: a, b 0.15, a–c 0.24 and b, c 0.15 (all non-significant). The full map ensemble (not just the mean) is used for all subsequent analyses

