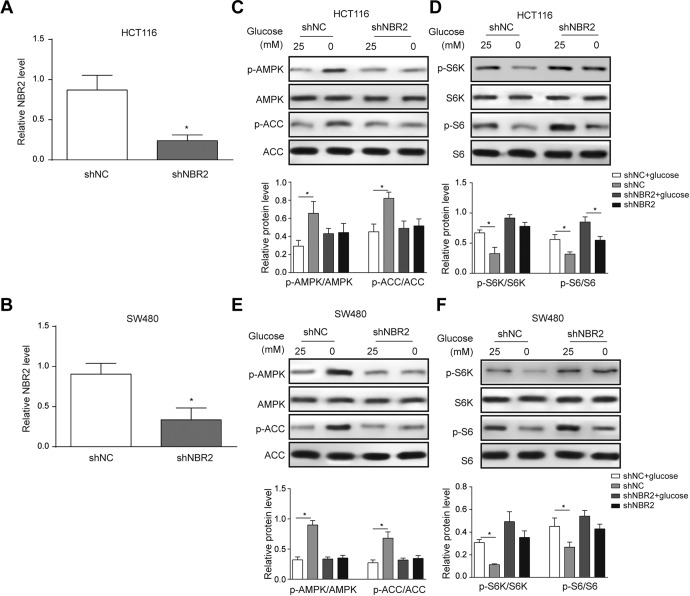
Figure 2.
Knockdown NBR2 in HCT116 and SW480 cells and the detected expression of glucose starvation-induced changes in protein phosphorylation in AMPK/mTOR signaling. A and B, Reverse transcription-PCR showed the level of NBR2 in both HCT116 and SW480 cells after transfection with shNBR2. C-F, Western blotting protein bands and quantitative analysis showed changes in the phosphorylation levels of AMPK, ACC, S6K, and S6 proteins in both HCT116 and SW480 cells treated with 0 or 25 mM glucose for 24 hours. Three independent experiments were performed, and the results are presented as the mean ± standard deviation. *P < .05. AMPK indicates adenosine monophosphate-activated protein kinase; RT-PCR, reverse transcription-polymerase chain reaction.

