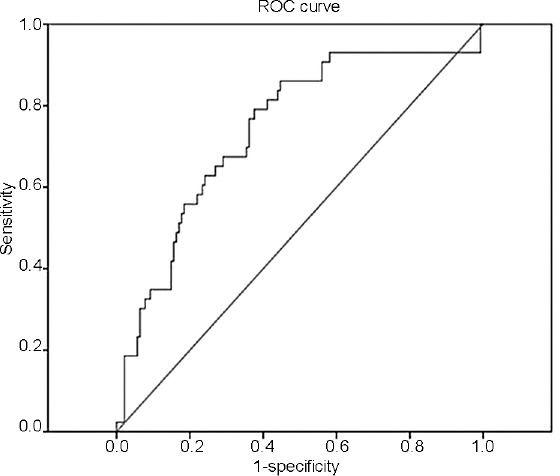
Figure 3.

ROC curve for the prediction of BOO of the proposed clinical nomogram in the subcohort (180 men) for the independent split-sample validation: area under the curve = 0.809 (95% CI: 0.755–0.844, P < 0.001). The curved line is the ROC curve generated from the proposed multivariable prediction model and the diagonal line is the reference line for random guessing. ROC curve: receiver-operating characteristic curve; BOO: bladder outlet obstruction; CI: confidence interval.
