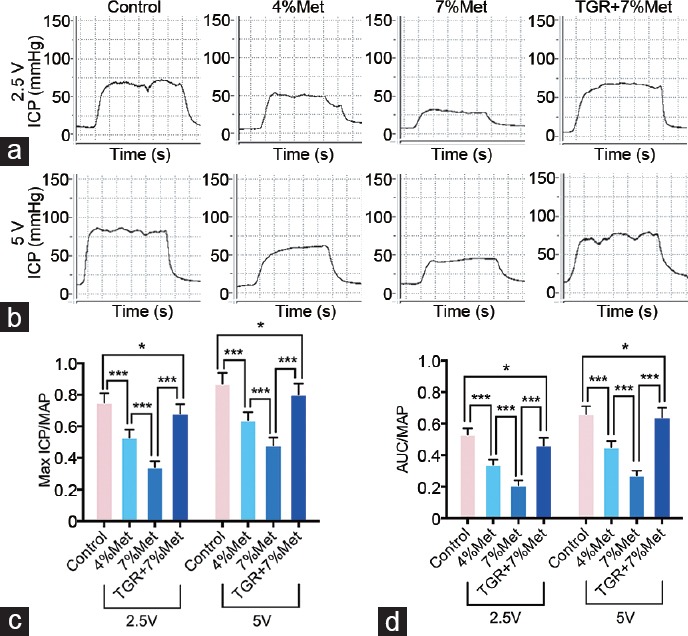
Figure 1.

Erectile function of rats elicited by cavernous nerve electrical stimulation. Representative ICP curves through electrostimulation of (a) 2.5 V and (b) 5 V for 1 min, respectively. Ratios of both max ICP and AUC to MAP of all four groups were presented through bar graphs: (c) for max ICP/MAP, and (d) for AUC/MAP. Data are expressed as mean ± standard deviation (n = 10 per group). *P < 0.05, ***P < 0.001. Met: methionine; TGR: transgenic rats; ICP: intracavernous pressure; AUC: area under the curve; MAP: mean arterial pressure.
