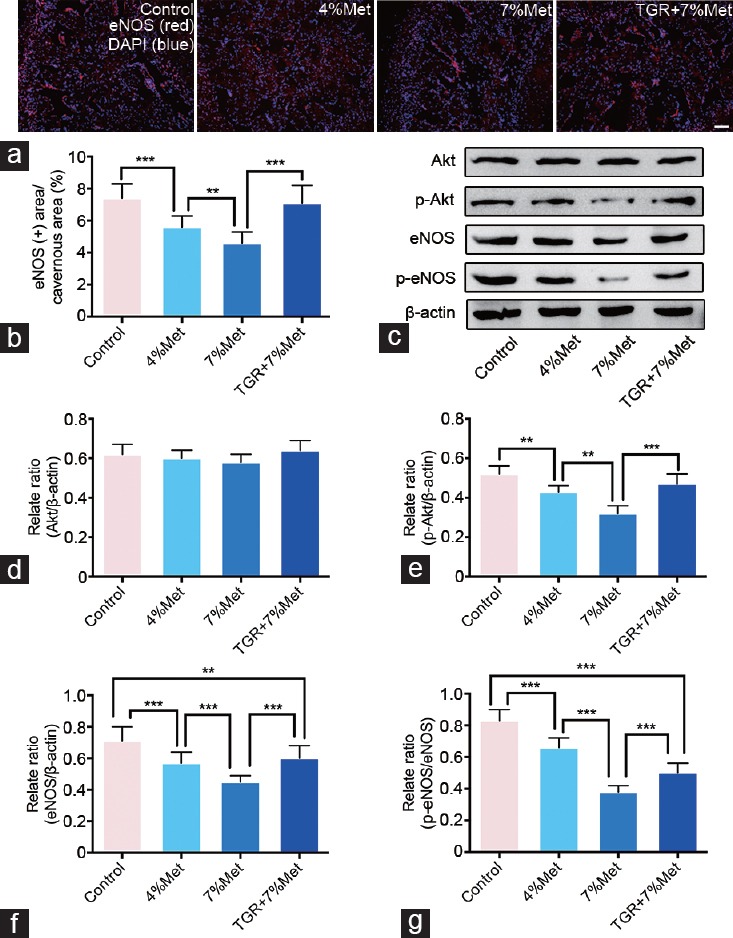
Figure 5.

hKLK1 activates Akt/eNOS signaling pathway in CC of rats with HHcy. (a) Immunofluorescence results of eNOS in CC of rats of all four groups. (b) Ratios of eNOS positive area to cavernous area were presented through bar graphs. (c) Representative western blot results for Akt, p-Akt, eNOS and p-eNOS in rats of all four groups. Expressions of Akt, p-Akt and eNOS with β-actin as the loading control in all four groups were presented through bar graphs: (d) for Akt, (e) for p-Akt and (f) for eNOS. (g) The ratio of p-eNOS/eNOS was presented through bar graph. Data are expressed as mean ± standard deviation (n = 5 per group). **P <0.01, and ***P < 0.001. Scale bars = 100 μm. Met: methionine; hKLK1: human tissue kallikrein-1; CC: corpus cavernosum; HHcy: hyperhomocysteinemia; TGR: transgenic rats; Akt: protein kinase B; eNOS: endothelial nitric oxide synthase.
