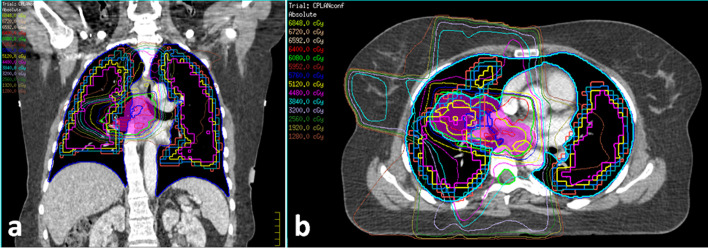
Figure 1.
Functional perfusion volumes and RT isodose contours: axial (a) and coronal (b) images through a right hilar tumour. The dark blue volume encompassing both lungs represents anatomical lung volume ("lung volume – PTV"). The smaller volumes contained within this represent the "perfusion volumes": Red = p20 (voxels with ≥20% of maximum voxel intensity); Green = p25; Pale blue = p30; Yellow = p40; Magenta = p50. The RT iso-dose contours are overlaid on these volumes to demonstrate the dose delivered to a right hilar and upper lobe tumour in this patient. PTV contour is not included in this image. PTV,planning target volumes; RT, radiation therapy.

