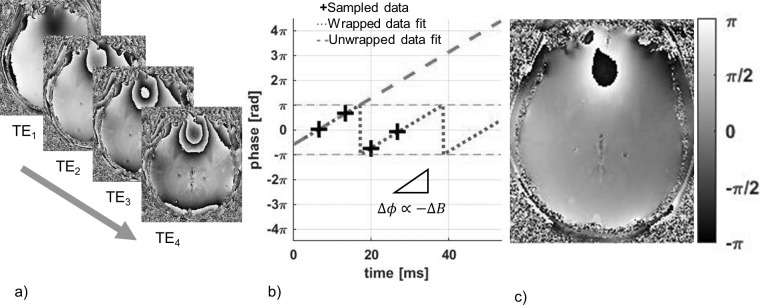
Figure 6.
In order to estimate , the variation of the phase images (a) acquired from four increasing echo times (6.50, 13.24, 19.99, 26.73 ms) are monitored over time. By fitting a linear function to the multiecho phase data, phase wraps between subsequent echoes can be estimated and removed to estimate the slope of the phase variation over time and the corresponding value of ΔB (b). This is done for every voxel in the acquisition in order to generate a map of temporally unwrapped ΔB values scaled by a factor of (c).

