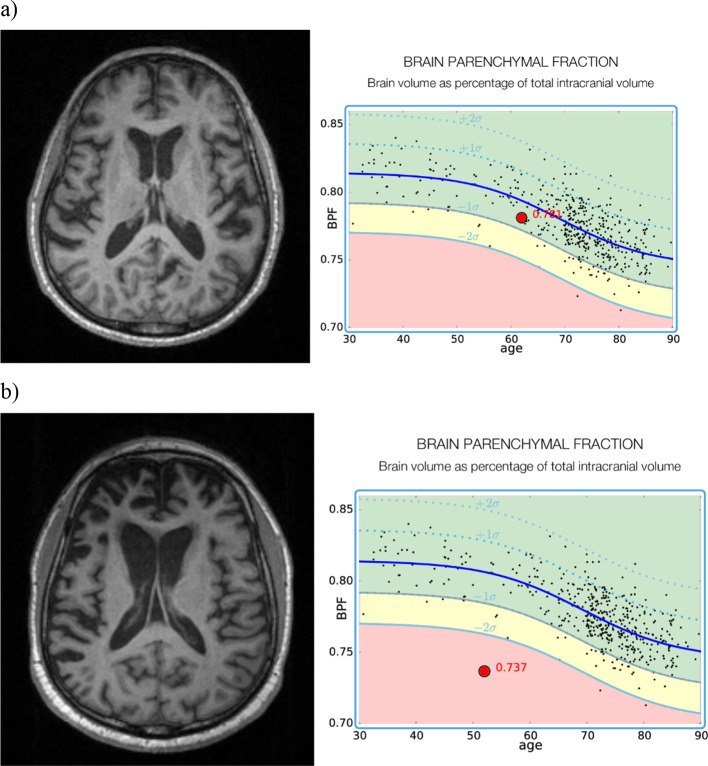
Figure 1. .
A normative data set of BPF has been generated from 468 normal control subjects aged 30–90 years. Mean and standard deviation BPF are shown with the solid and dotted blue lines. The subject’s BPF (large red dot) is placed along the normative curve for easy comparison with normal control subjects. Examples shown are of (a) normal control; (b) a subject with FTD. BPF, brain parenchymal fraction; FTD, frontotemporal dementia.

