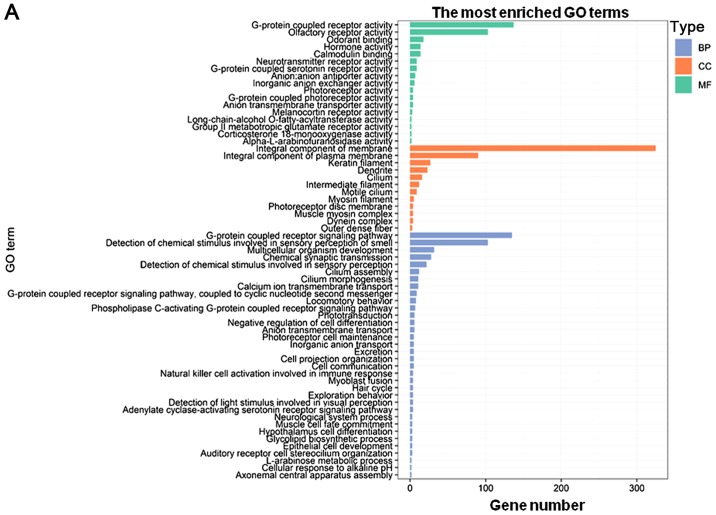
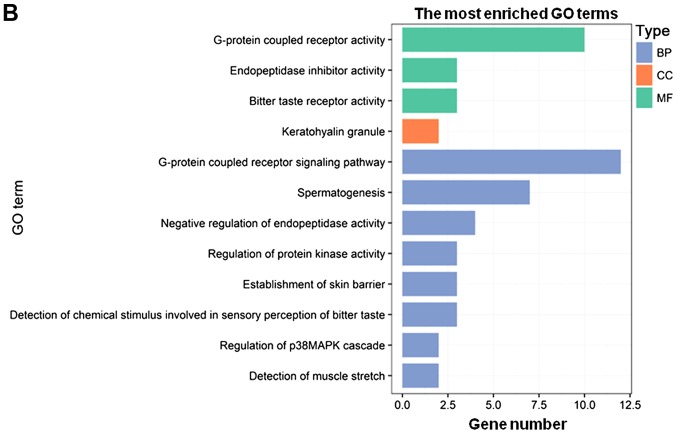
Figure 5.
GO enrichment analysis maps of co-expressed PCGs associated with certain long non-coding RNAs. (A) The most enriched GO terms of PCGs co-expressed with DNAH17-AS1. (B) The most enriched GO terms of PCGs co-expressed with RP11-400N13.2. The colors of the columns represent the different types of terms. GO, Gene Ontology; PCGs, protein-coding genes; BP, biological process; CC, cellular component; MF, molecular function.


