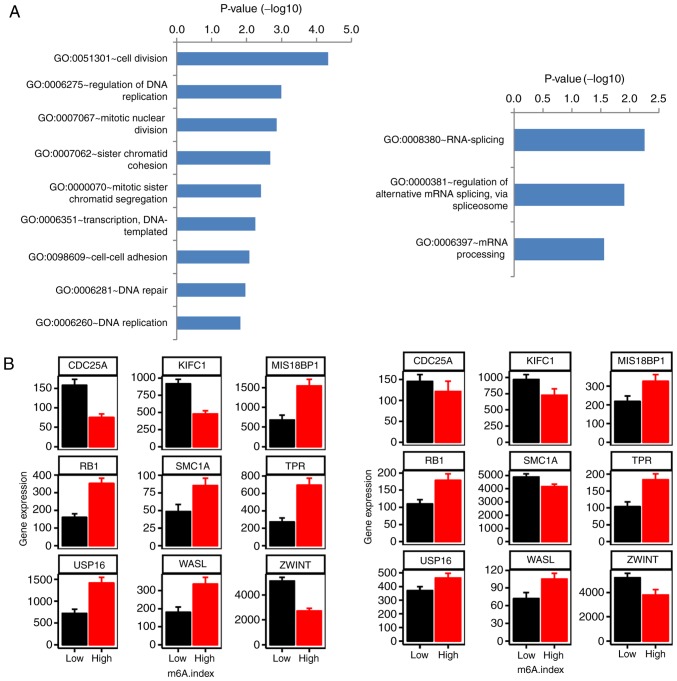
Figure 6.
Significantly enriched pathways of differentially expressed genes between the m6A.index-high and the m6A.index-low groups of patients with mantle cell lymphoma. (A) The bar plot indicates the significantly enriched cell division (left) and the RNA metabolism (right) pathways. (B) The differentially expressed genes identified between the m6A.index-high and the m6A.index-low mantle cell lymphoma groups in the cell division pathway. The left plot corresponds to the GSE93291 dataset (n=123), while the right plot corresponds to the GSE21452 dataset (n=64). A two-sided unpaired Student's t-test was used. P<0.05 for all histograms. m6A, N6-methyladenosine.

