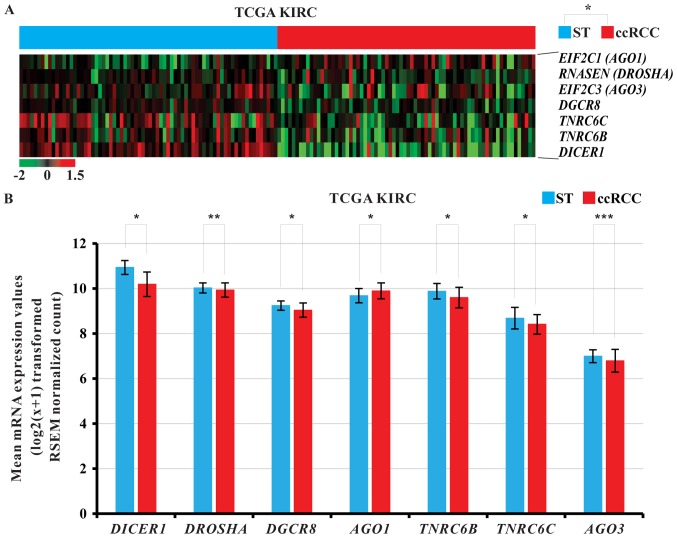
Figure 2.
(A) Heat map presenting significantly differential mRNA expression of the miRNA biogenesis-related genes in ccRCC tissues compared with the ST of TCGA KIRC cohort. The data are presented in matrix format in which each row represents an individual gene and each column represents a single tissue. Each cell in the matrix represents the expression level of a gene feature in an individual tissue. Expression levels have been standardized (centered and scaled) within columns for visualization. The red and green colors in cells reflect relative high and low expression levels, respectively, as indicated in the scale bar. Images were obtained by re-analysis of the raw data of the TCGA KIRC cohort. ccRCC tissues were ordered from STs to ccRCC tissues according to the standardized expression level of each gene as indicated. *P<0.05 (ST vs. ccRCC). (B) Relative mRNA levels of various miRNA biogenesis-related genes in ccRCC tissues and their corresponding ST. *P<0.001, **P=0.029 and ***P=0.002, as indicated. TCGA KIRC, The Cancer Genome Atlas kidney clear cell carcinoma; ccRCC, clear cell renal cell carcinoma; ST, adjacent non-neoplastic surround tissues.

