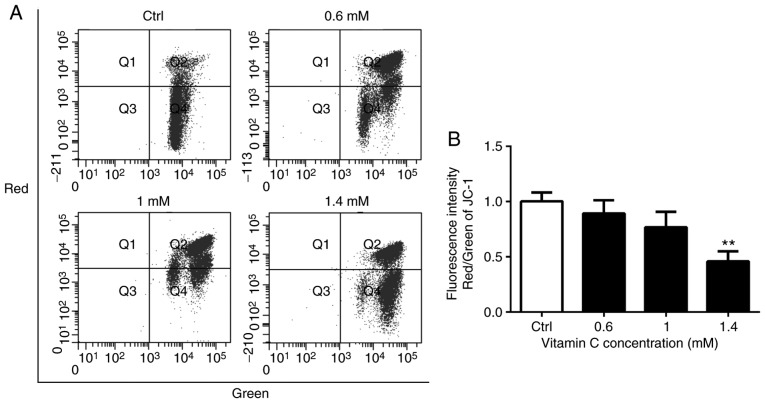
Figure 3.
Vitamin C decreases mitochondrial membrane potential in A375 cells. (A) Cells were cultured and treated for 6 h in a medium containing 0, 0.6, 1 or 1.4-mM vitamin C. Cells were loaded with JC-1 and then analyzed by flow cytometry. Fluorescence intensities were measured with FACSCalibur flow cytometer. (B) Histograms indicate the ration of red to green fluorescence intensities in A375 cells after vitamin C treatment. **P<0.01 vs. Ctrl. JC-1, 5,5′,6,6′-tetrachloro-1,1′,3,3′-tetraethyl enzamidazolocarbocyanin iodide; Ctrl, control.

