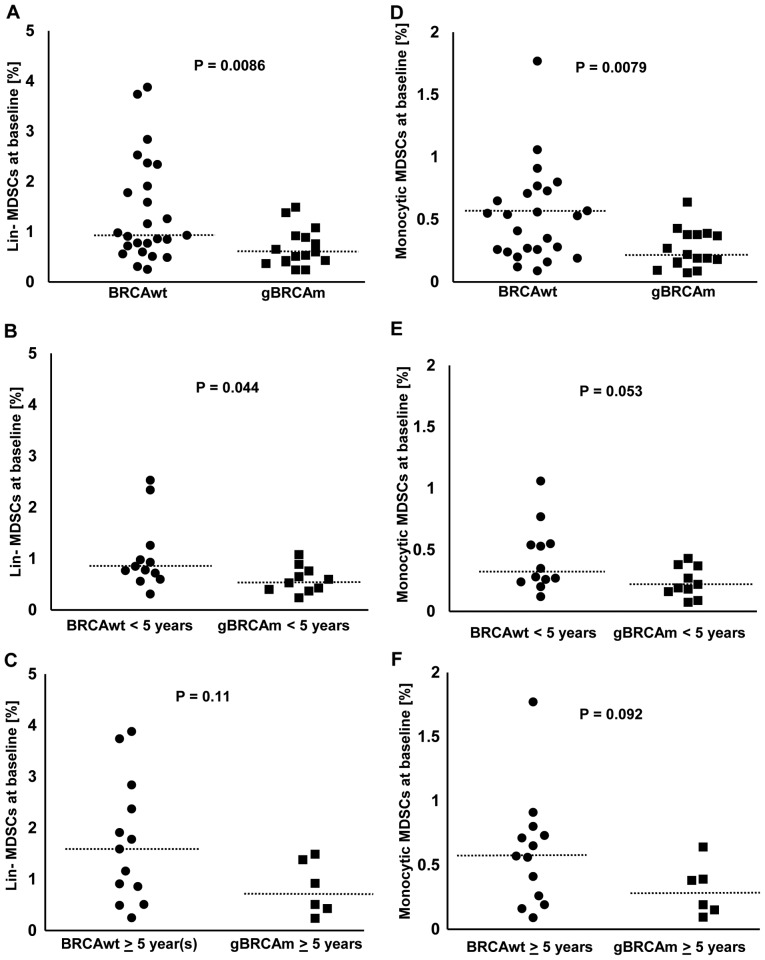
Figure 1.
The percentage of circulating MDSCs in gBRCAm and BRCAwt HGSOC (Cohort 1). (A) The percentage of lin-MDSCs was lower in gBRCAm HGSOC (n=25) compared with BRCAwt HGSOC (n=16; P=0.0086). (B and C) The difference of lin-MDSCs between gBRCAm (n=12) and BRCAwt (n=10) samples was seen in those <5 years from initial diagnosis (P=0.044) which did not remain in those [gBRCAm (n=13) and BRCAwt (n=6)] ≥5 years from initial diagnosis (P=0.11). (D) The percentage of monocytic MDSCs was lower in gBRCAm HGSOC (n=25) compared with BRCAwt HGSOC (n=16; P=0.0079). (E and F) There was a trend toward a lower percentage of monocytic MDSCs in gBRCAm compared with patients with BRCAwt, seen only in those <5 years from initial diagnosis (P=0.053), but not in those ≥5 years from initial diagnosis (P=0.092). The dotted lines represent the median values. gBRCAm, germline BRCA mutation; BRCAwt, germline BRCA wild-type; MDSCs, myeloid-derived suppressor cells; HGSOC, high-grade serous ovarian cancer.

