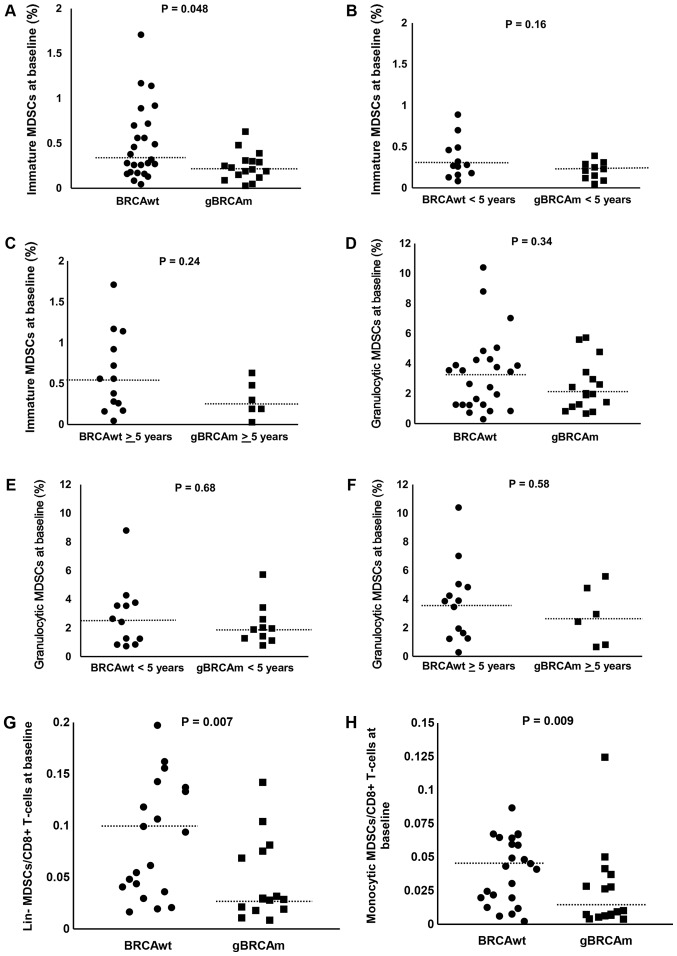
Figure 3.
The percentage of circulating immature and granulocytic MDSCs in gBRCAm and BRCAwt HGSOC (Cohort 1). (A) The percentage of immature MDSCs was lower in gBRCAm HGSOC (n=25) compared with BRCAwt HGSOC (n=16; P=0.048). (B and C) The difference of immature MDSCs between gBRCAm (n=12) and BRCAwt (n=10) samples was not seen in those <5 years from initial diagnosis (P=0.16), or in those ≥5 years from initial diagnosis (P=0.24). Percentage of granulocytic MDSCs was not different between (D) gBRCAm and BRCAwt HGSOC (P=0.34), or (E) in those <5 years from initial diagnosis (P=0.68), or (F) in those ≥5 years from initial diagnosis (P=0.58). The ratio of (G) lin- and (H) monocytic MDSCs to CD8+ T cells were lower in gBRCAm (P=0.007 and P=0.009, respectively). The dotted lines represent the median values. MDSCs, myeloid-derived suppressor cells; gBRCAm, germline BRCA mutation; BRCAwt, germline BRCA wild-type; HGSOC, high grade serous ovarian carcinoma.

