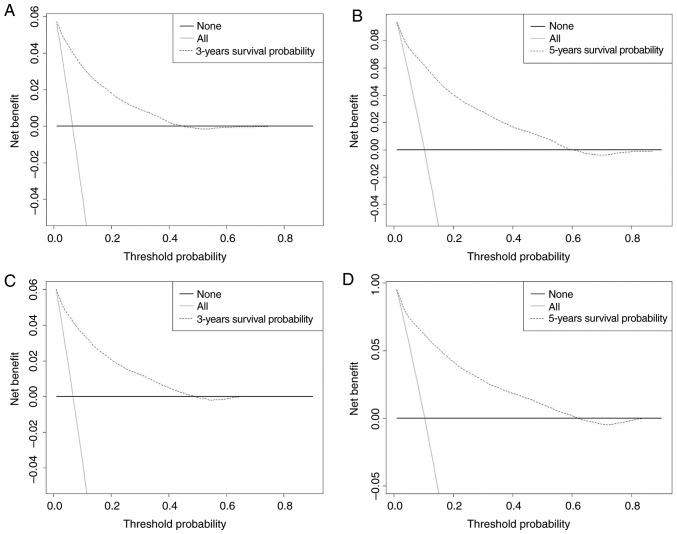
Figure 4.
DCA of the 3- and 5-year OS for the training and validation cohorts. The abscissa represents the threshold probability and the ordinate represents the net benefit rate. The horizontal line indicates that all samples are negative and all are not treated, with a net benefit of zero. The oblique line indicates that all samples are positive. The net benefit is represented by a negative slope. The dashed line does not coincide with the other two lines, and when it is in the upper right corner, it means that the model is valuable. (A) DCA of the 3-year OS for the training cohort. (B) DCA of the 5-year OS for training cohort, (C) DCA of 3-year OS for the validation cohort. (D) DCA of the 5-year OS for the validation cohort. DCA, decision curve analysis; OS, overall survival.

