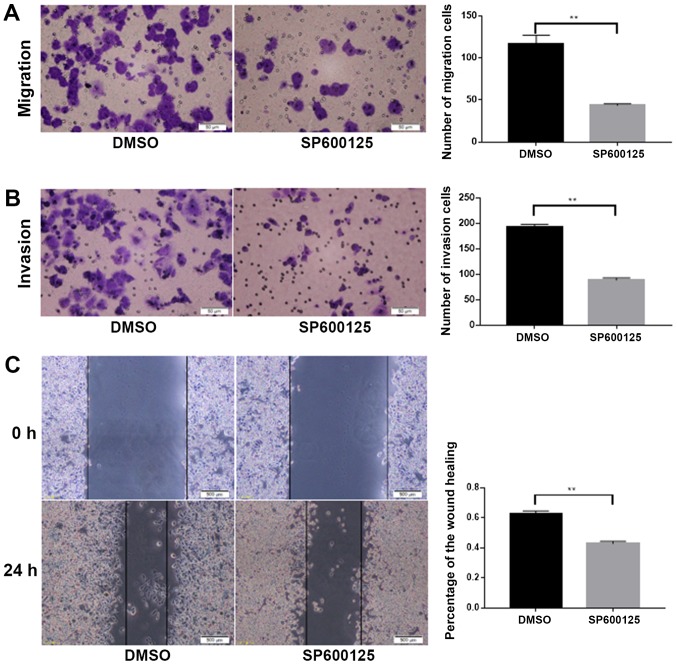
Figure 4.
JNK promoted migration and invasion in HCT116 cells. (A) The results of migration assays for HCT116 cells following the addition of SP600125. Scale bar=100 µm. (B) The results of invasion assays for HCT116 cells following the addition of SP600125. Scale bar=100 µm. (C) The results of wound healing assays for HCT116 cells prior to, and following the addition of SP600125. Scale bar=400 µm. **P<0.01.

