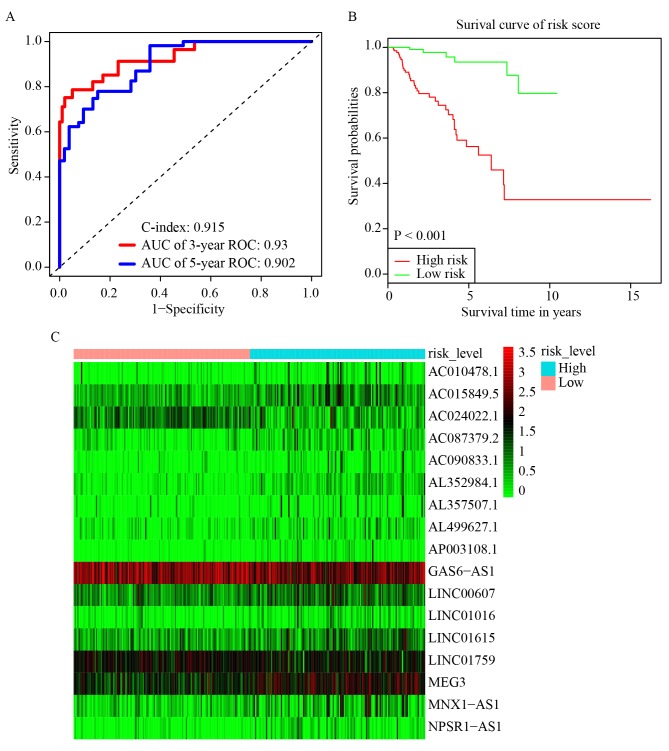
Figure 2.
Establishment and evaluation of the prognostic model. (A) 3-year and 5-year ROC curves and C-index of the 17 key lncRNAs. AUC=0.93 (3-year ROC) and AUC=0.902 (5-year ROC), C-index=0.915. (B) KM survival curve of the risk level. Overall survival rate of patients with low-risk scores was significantly higher (P<0.001). (C) Heatmap of the expression levels of the 17 key lncRNAs in the high-risk group and low-risk group. Red and green represent increased and decreased normalized expression value of the lncRNAs in all patients, respectively. KM, Kaplan-Meier; ROC, receiver operating characteristic; AUC, area under curve; lncRNAs, long non-coding RNAs.

