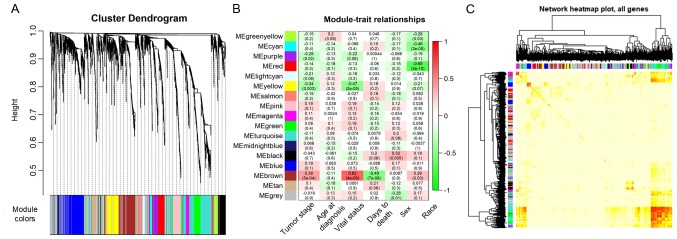
Figure 3.
Modularization of the adrenocortical carcinoma-associated genes and clinical characterization of the modules. (A) Clustering dendrograms of genes, without similarity based on topological overlap. A total of 17 co-expression modules were constructed and were each assigned a different color. (B) Heat map of the gene network depicting the topological overlap matrix among all the genes in the analysis. Lighter colors represent a lower degree of overlap and progressively darker red colors represent a greater degree of overlap. The blocks of the darkest colors along the diagonals are the modules. The gene dendrogram and module assignment are also shown along the left side and the top. (C) Module-trait associations. Each row corresponds to a module eigengene and each column corresponds to a trait. Each cell contains the corresponding correlation and P-value. The table is color-coded by correlation according to the color legend.

