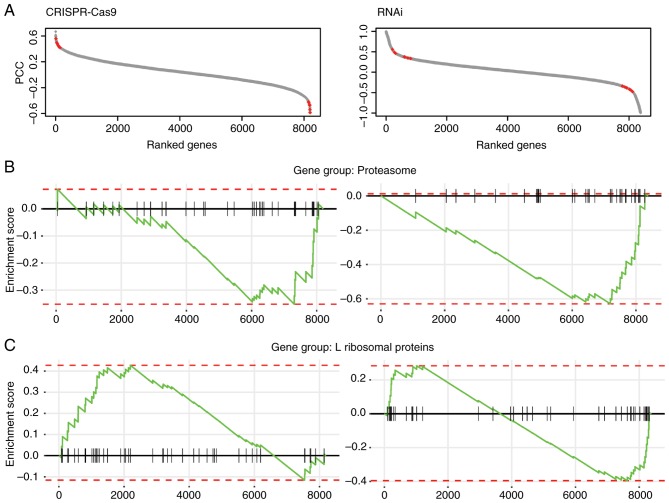
Figure 1.
Overview of fitness profile correlations between β-catenin and selected genes in the present study. (A) Scatter plot of ranked genes based on the PCC. Red dots represent β-catenin targets identified in the present study. The ranked genes were significantly enriched in (B) proteasome and (C) L ribosomal proteins. L ribosomal proteins, large ribosomal proteins; PCC, Pearson correlation coefficient; RNAi, RNA interference; Cas9, CRISPR associated protein 9.

