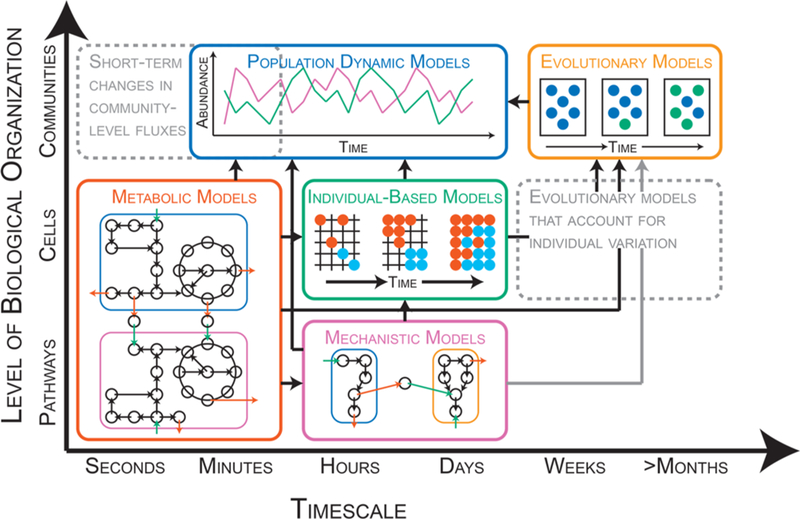
Figure 2.

Schematic representation of modeling frameworks for processes occurring at different temporal (x-axis) and spatial (y-axis) scales. Metabolic, population-dynamic, individual-based, mechanistic, and evolutionary models are represented by the red, blue, green, purple, and orange boxes, respectively. Dashed gray boxes indicate temporal/spatial scales where modeling frameworks are currently missing. Black arrows between boxes indicate existence of publications that link modeling frameworks. Gray arrows between boxes indicate opportunities to link modeling frameworks. Metabolic models: Steady-state flux of metabolites (black circles) in and out (green arrows and red arrows, respectively) of two cell populations (blue and purple boxes) as predicted by a genome-scale metabolic network (black circles and arrows). Population-dynamic models: Change in abundance of two populations (green and purple) over time. Individual-based models: Emergence of spatial partitioning of two populations of cells (red and blue circles) on a discrete lattice, a structured arrangement of points representing a surface (black gridlines). Mechanistic models: Dynamic flux of metabolites (black circles) in and out (green arrows and red arrows, respectively) of two cell populations (blue and orange boxes) as predicted by a model of a biochemical pathway (black circles and arrows). Evolutionary models: Change in community population structure through evolutionary time. Initially, the population is homogeneous (blue circles, left-most rectangle). One cell acquires a mutation that provides a fitness advantage (green circle, middle rectangle). As a result, the community population structure changes over time (green and blue circles, right-most rectangle).
