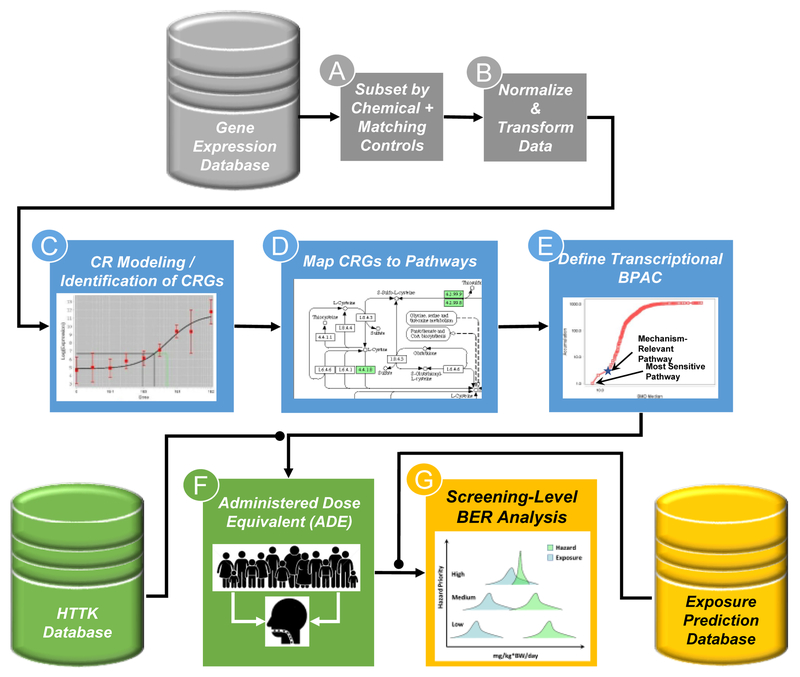
Figure 2. Framework for the use of HTTr data in screening level risk assessment.
HTTr screening data is generated and housed in a database (gray cylinder). For analysis, data are subset by chemical of interest and corresponding vehicle controls (A) and the data is normalized and transformed (B) in a manner appropriate for the HTTr assay being used. The normalized and transformed data is then used for gene-level concentration response (CR) modeling, identification of concentration-responsive genes (CRGs) and calculation of potency estimates for biological effects (C). Typically, a pre-filter (i.e. Trend test or ANOVA) is applied to filter out probes that do not show any indication of concentration-dependent changes in expression prior to modeling. CRGs are then mapped to pathways using existing knowledgebases (D). Pathway-level aggregate potency values are calculated and a biological pathway altering concentration (BPAC) is identified corresponding to the most sensitive mechanistically-relevant pathway (star) or the most sensitive overall pathway (E). BPACs are converted to ADE using experimentally-derived or predicted estimates of hepatic clearance and plasma protein binding (green cylinder) and reverse dosimetry using high-throughput toxicokinetic (httk) modeling of a heterogeneous human population (F). The ADEs are then compared to known or predicted human exposure levels (yellow cylinder), including estimates of uncertainty, to determine if an overlap dose of a chemical expected to produce perturbations in human biology and the dose of a chemical that may result from human exposure in the environment (G). Chemicals with a BPAC ADE that overlaps with predicted exposure estimates may be of more concern than those that do not.

