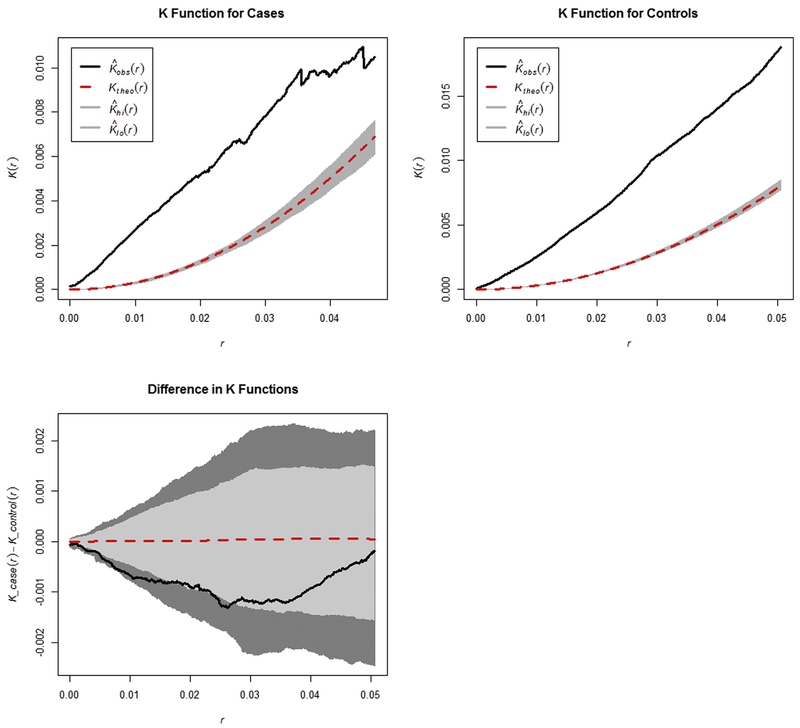
Fig. 2.
Ripley’s K functions measuring overall spatial clustering across the entire study area for cases, controls, and the difference between K functions for cases and controls. Black lines indicated the observed values, dotted red lines represent null hypothesis of no clustering, and dark gray envelopes indicate the 95% confidence interval. (For interpretation of the references to color in this figure legend, the reader is referred to the Web version of this article.)

