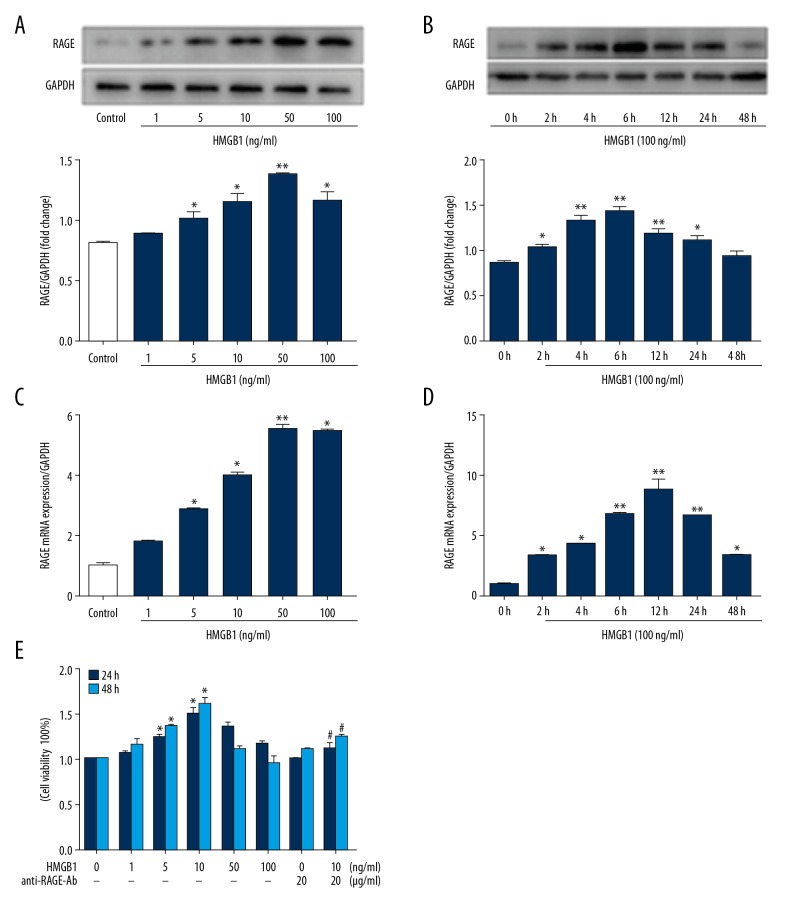
Figure 2.
Effects of HMGB1 on RAGE expression and cell viability in EPCs. EPCs were treated with HMGB1 (0–100 ng/ml) for different times (0–48 h). (A, B) Western blot was utilized to measure expression of RAGE. (C, D) mRNA expression level of RAGE was measured by qRT-PCR in EPCs. (E) The viability of EPCs was analyzed by CCK-8. The data are expressed as the means ±SEM. * P<0.05, ** P<0.01, versus the control group. # P<0.05, versus the HMGB1 (10 ng/ml) group.

