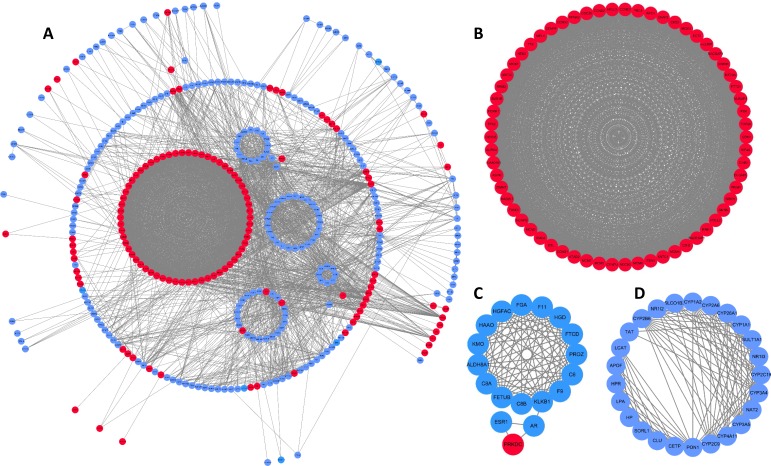
Figure 2. DEG PPI network and modular analysis.
(A) STRING was employed to create a PPI network of 403 nodes and 3,502 edges, visualized using Cytoscape software. Genes that are upregulated are shown by red nodes, while those that are downregulated are blue. The MCODE plug-in was used to analyze highlighted regions. (B) Clustering module 1 scored 58.492 with 62 nodes and 1,784 edges. (C) Clustering module 2 scored 11.529 with 18 nodes and 98 edges. (D) Clustering module 3 scored 10.917 with 25 nodes and 131 edges.

