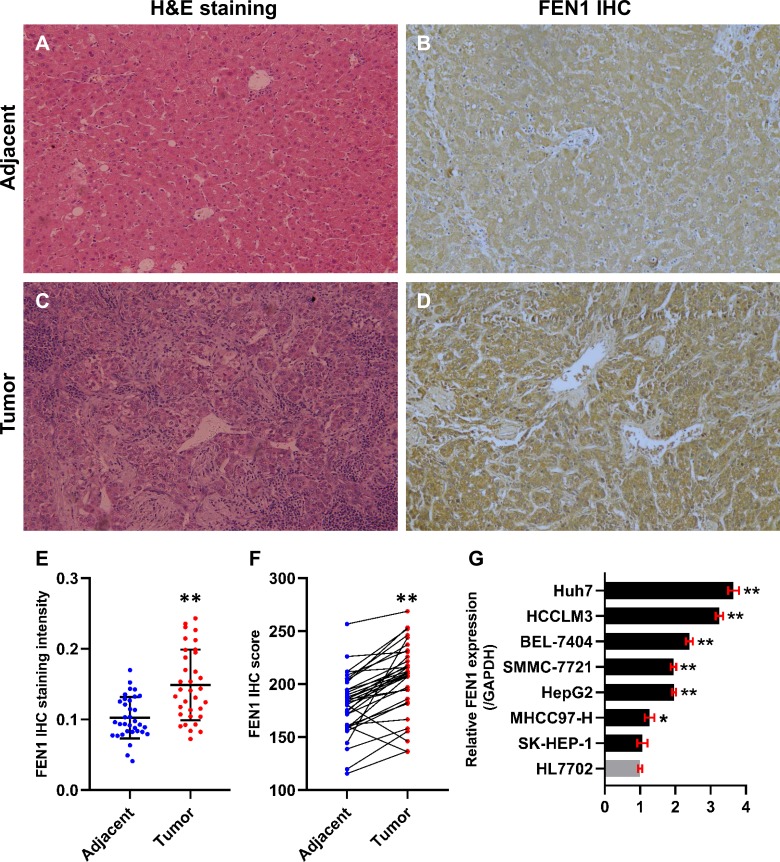
Figure 8. FEN1 was up-regulated in HCC tissues and hepatoma cell lines.
H & E staining of adjacent tissue (A) and HCC tissue (C). (B) FEN1 IHC in adjacent tissue. (D) FEN1 IHC in HCC tissue. (E) FEN1 IHC staining quantification; n = 34/group. (F) FEN1 IHC scores; n = 34/group. (G) FEN1 expression in control HL7702 liver cells and in hepatoma cell lines (as indicated); *P < 0.05, **P < 0.01.

