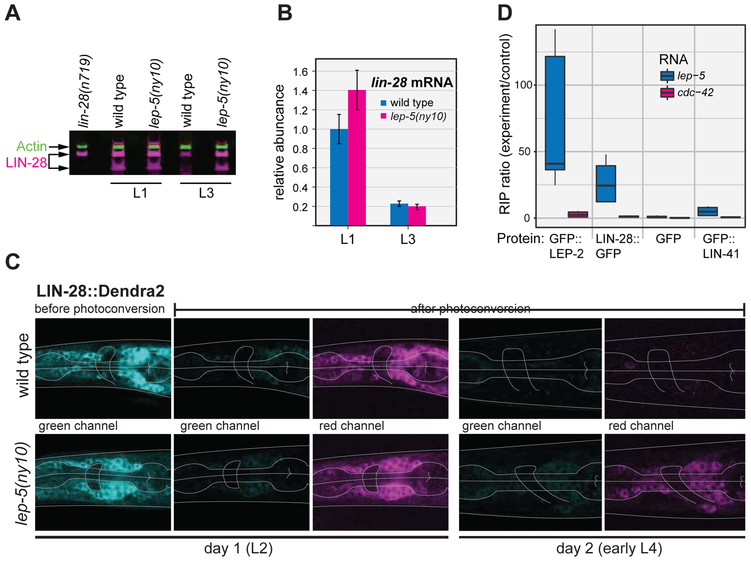
Figure 5. lep-5 lncRNA promotes LIN-28 degradation.
(A) Detection of endogenous LIN-28 protein by Western blot (actin used for a normalization control). (B) lin-28 mRNA levels determined by qPCR. Values are normalized to wild-type L1s. (C) Analysis of a LIN-28::Dendra2 fusion protein in WT (top) and lep-5(ny10) (bottom) males. Shown are neurons in the head region (pharynx and nerve ring indicated by grey lines). From left to right: green fluorescent signal before photoconversion, diminished green signal after photoconversion, red signal after photoconversion, green and red signals in the same animals 24 hours later. (D) Ratios of lep-5 lncRNA and control mRNA for cdc-42 in immune-precipitation of GFP-tagged proteins using anti-GFP relative to negative control IP measured by qPCR (see STAR Methods for details). For each set of triplicate experiments, the first to third quartile is represented as a box, the median as a black bar and the maximum and minimum values as whiskers.

