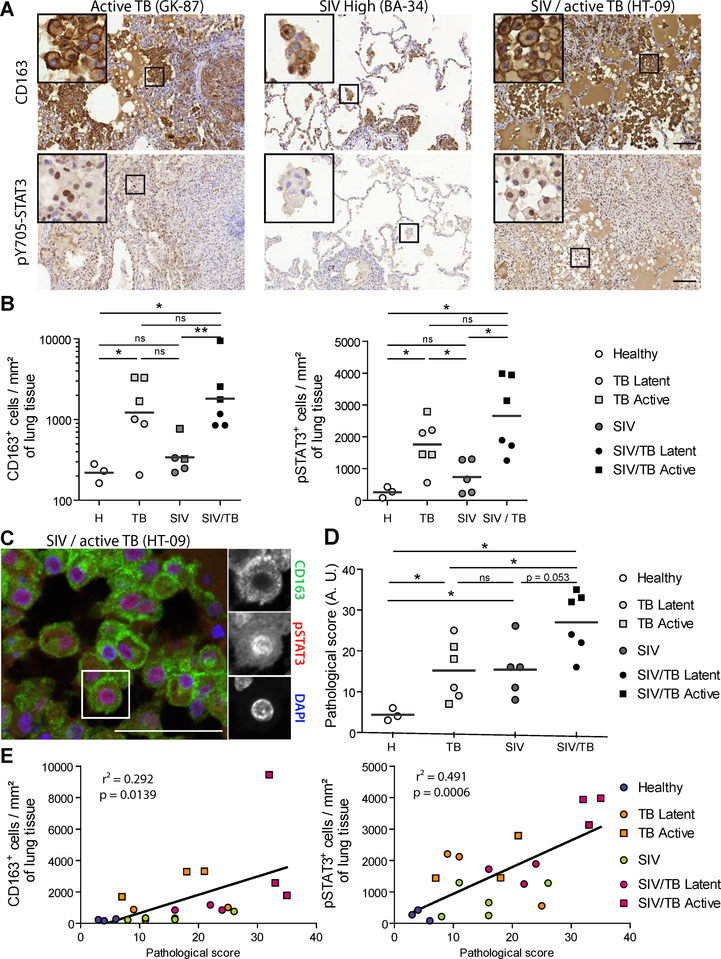
Figure 2. (Related to Table S2, S3). Accumulation of M(IL-10) macrophages in the lung of co-infected non-human primates (NHPs) correlates with pathology.
(A)Representative immunohistochemical images illustrate higher number of CD163+ cells and pY705-STAT3+ cells in lung biopsies of SIV-Mtb infected NHPs compared to Mtb or SIV mono-infected NHPs. Scale bar, 100μm. Insets are 4x zooms. (B) Quantification of the number of CD163+ cells (left) and pY705-STAT3+ cells (right) per mm2 of lung tissue of healthy (H), SIV-infected, Mtb-infected and SIV-Mtb-co-infected NHPs. (C) Immunohistochemistry staining of lung biopsy of SIV-Mtb co-infected NHP showing the nuclear localization of pY705-STAT3 (red, center) in CD163 alveolar macrophages (green, top). Nuclei are stained using DAPI (blue, bottom). Scale bar, 50 μm. Insets are 1.3x zooms. (D) Vertical scatter plot showing the pathological scoring of NHPs used in this study (See Table S3). (E) Correlation between CD163+ cells (left) or pY705-STAT3+ cells (right) per mm2 of lung tissue and pathological score in the indicated NHPs. Each symbol within vertical scatter plots represents a single animal. Mean value is represented as a dark grey line. Statistical analyses: Two-tailed Mann-Whitney (B,D). * p≤0.05; ** p≤0.005; ns, not significant.

