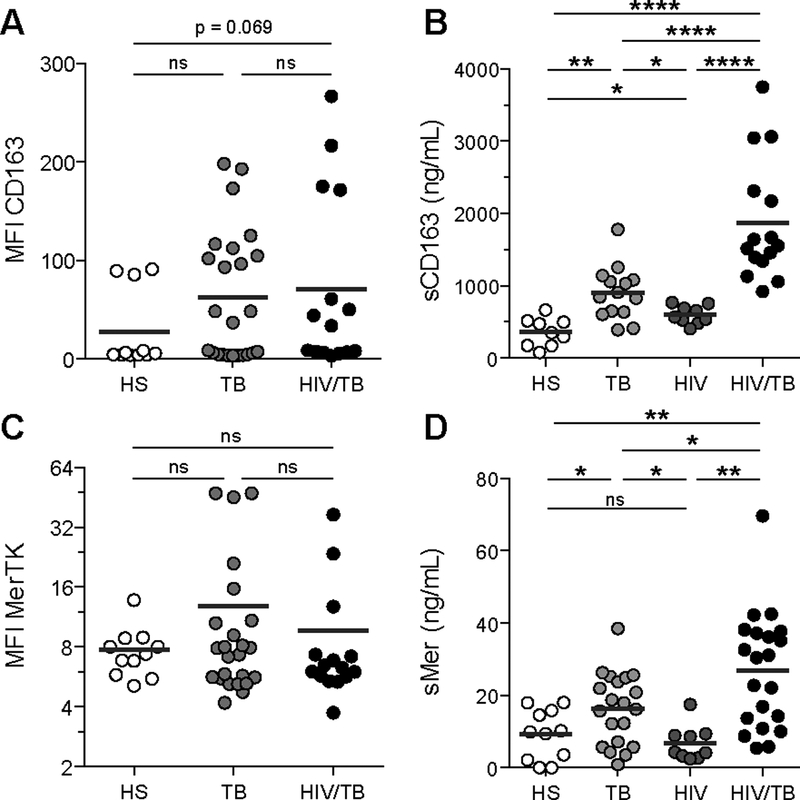
Figure 3. (Related to Figure S4 and Table S1). Systemic expansion of the M(IL-10) monocyte population in co-infected patients.

(A) Vertical scatter plots showing the median fluorescence intensity (MFI) of cell-surface marker CD163 on CD14+ monocytes from peripheral blood of healthy subjects, TB patients (TB) and HIV-1/Mtb co-infected patients (HIV/TB). (B) Vertical scatter plots showing the amount of sCD163, the cleaved form of CD163 in the serum of healthy subjects, TB, HIV and HIV/TB patients. (C) Vertical scatter plots showing the MFI of cell-surface marker MerTK on CD14+ monocytes from PB of healthy subjects, TB and HIV/TB patients. (D) Vertical scatter plots showing the amount of sMer, the cleaved form of MerTK in the serum of healthy subjects, TB, HIV and HIV/TB patients. Each circle within vertical scatter plots represents a single donor. Mean value is represented as a dark grey line. Statistical analyses: Two-tailed, Mann-Whitney (A-C), unpaired t-test (D). * p≤0.05; ** p≤0.005; *** p≤0.0005; ns, not significant.
