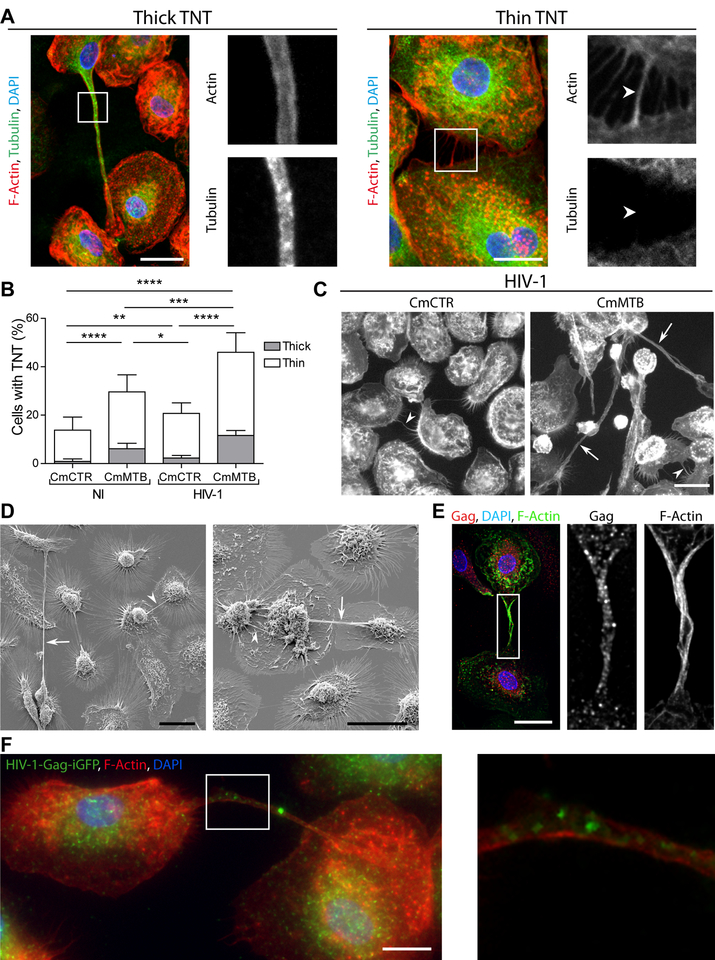
Figure 5. (Related to Movie 3). TB enhances HIV-1-induced tunneling nanotube (TNT) formation.
(A)Representative immunofluorescences image of macrophages interconnected through thick (left) and thin (right) TNTs. F-Actin (red), Tubulin (green), DAPI (blue). Scale bar, 20 μm. The arrows point at the thin TNT without microtubules. (B) Stacked bars showing the percentage of cells with thick (grey) and thin (white) TNTs of day 6 uninfected or HIV-1-infected macrophages treated with CmCTR or CmMTB. Data in histograms are represented as mean ± SD. (C) Representative wide field Immunofluorescence (IF) images showing F-actin staining in day 6 HIV-1 infected macrophages, treated with CmCTR or CmMTB. Arrows: thick TNTs; arrowheads: thin TNTs. Scale bar, 20μm. (D) Scanning electron microscopy images showing TNTs of day 6 HIV-1 infected macrophages, treated with CmMTB. Arrows : thick TNTs ; arrowheads : thin TNTs. Scale bar, 20μm. (E) Deconvolution microscopy images showing HIV-1 Gag intra-TNT distribution in day 6 HIV-1 infected macrophages, treated with CmMTB. HIV-1 Gag (red), F-actin (green), DAPI (blue). Scale bar, 20μm. Insets are 3x zooms. (F) Immunofluorescence (IF) images showing viral particles in TNT of day 6 HIV-1-Gag-iGFP infected macrophages previously treated with CmMTB. HIV-1-Gag-GFP (green), F-actin (red) and DAPI (blue). Scale bar, 10μm. Inset is 4x zoom. Statistical analyses: Two-tailed paired t-test (B). * p≤0.05; ** p≤0.005; *** p≤0.0005; **** p≤0.0001; ns, not significant.

