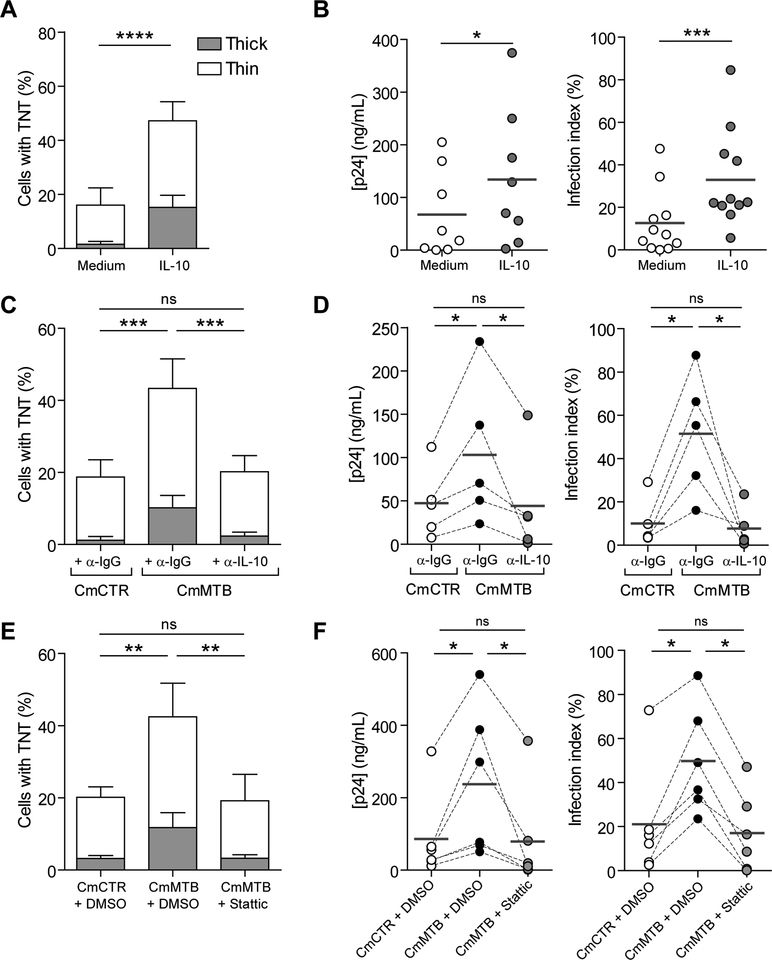
Figure 6. (Related to Figure S2, S6). TB-driven tunneling nanotube (TNT) formation and increased of HIV-1 infection are dependent on the IL10/STAT3 axis.
(A)Stacked bars showing the percentage of cells with thick (grey) and thin (white) TNTs of day 6 HIV-1 infected macrophages untreated or treated with recombinant IL-10 (10ng/mL). (B) Vertical scatter plots showing p24 concentration (left) and infection index (right) of day 13 HIV-1 infected macrophages untreated or treated with recombinant IL-10 (10ng/mL). (C) Stacked bars showing the percentage of cells with thick (grey) and thin (white) TNTs of day 6 HIV-1 infected macrophages treated with IL-10-depleted (α-IL-10) CmMTB and mock depletion controls (α-IgG) of CmCTR and CmMTB. (D) Vertical scatter plots showing p24 concentration (left) and infection index (right) of day 13 HIV-1 infected macrophages treated with IL-10-depleted (α-IL-10) CmMTB and mock depletion controls (α-IgG) of CmCTR and CmMTB. (E) Stacked bars showing the percentage of cells with thick (grey) and thin (white) TNTs of day 6 HIV-1 infected macrophages treated with CmCTR, CmMTB or CmMTB in the presence of the STAT3 activation inhibitor, Stattic (1μM). (F) Vertical scatter plots showing p24 release (left) and infection index (right) of day 13 HIV-1 infected macrophages treated with CmCTR, CmMTB or CmMTB in the presence of the STAT3 activation inhibitor, Stattic (1μM). Statistical analyses: Two-tailed, Wilcoxon matched-paired signed rank test (B right, D right, F), paired t-test (A, B left, C, D left, E). * p≤0.05; ** p≤0.005; *** p≤0.0005; ns, not significant.

