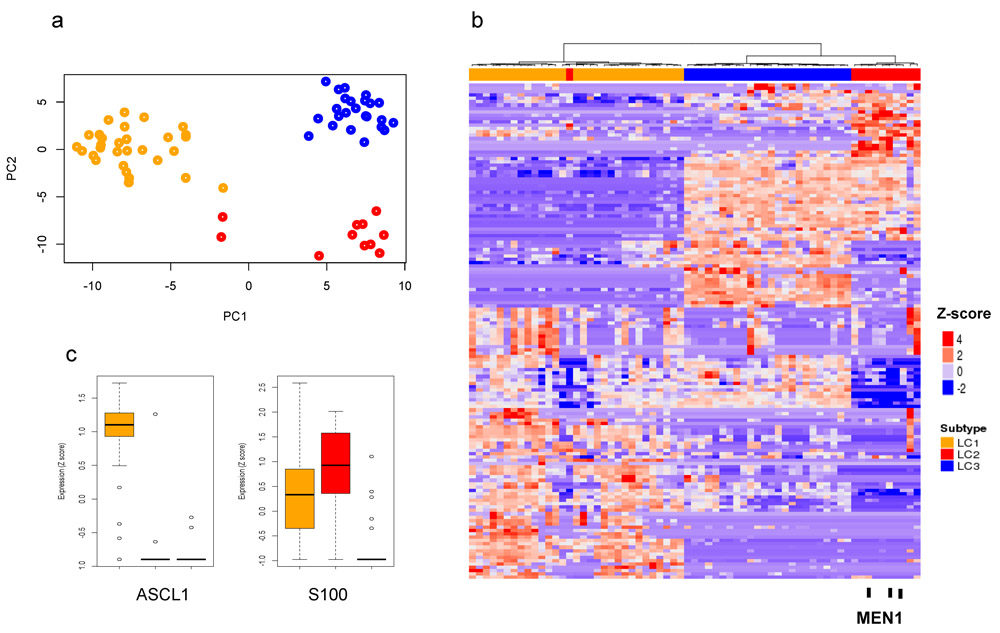
Figure 4. Validation of novel classification of LC on an independent collection of LCs from Fernandez-Cuesta et al.
a) and b) PCA and Heatmap of hierarchical clustering of gene expression of LCs from Fernandez-Cuesta et al., using our top 100 variable gene set signature shows three distinct subtypes LC1 (orange), LC2 (red) and LC3 (blue). Black sticks represent samples with MEN1 mutations and they are all found in subtype LC2. c) Boxplot of ASCL1 and S100 gene expression from Fernandez-Cuesta et al. is consistent with LC subtypes. Centerline, median; bounds of box, the 1st and 3rd quartiles; and upper and lower whisker is defined to be 1.5 × IQR more than the third and first quartile.

