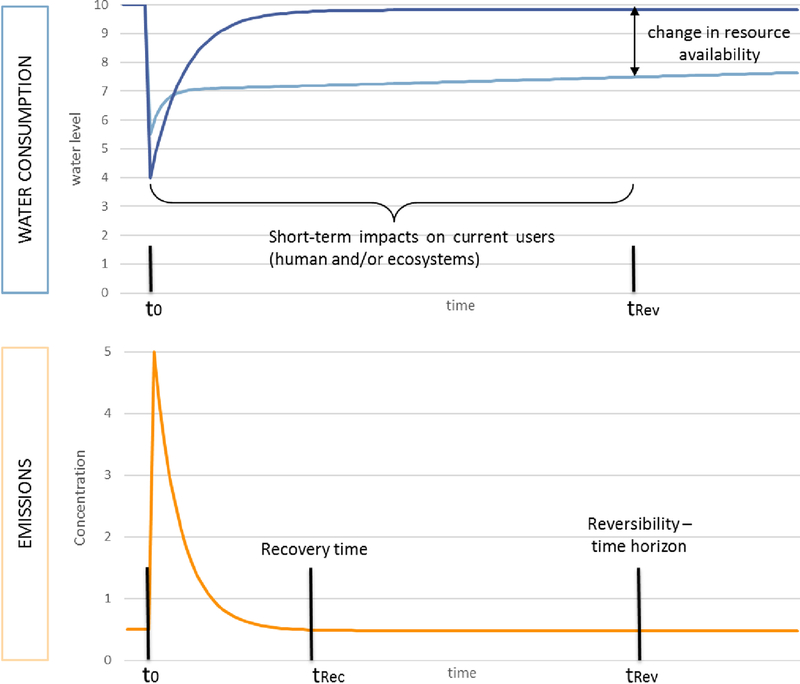
Fig. 4:
Illustration of water consumption (light and dark blue) and a pulse emission (orange), where t0 = time at which the intervention occurs, tRec = recovery time, and tRev = reversibility time horizon, distinguishing the boundary between short and long-term, potential impacts. The curves are drawn for illustrative purposes only and show different ideal patterns i.e. full recovery within the time horizon (orange), almost complete recovery (dark blue) and partial recovery (light blue)

