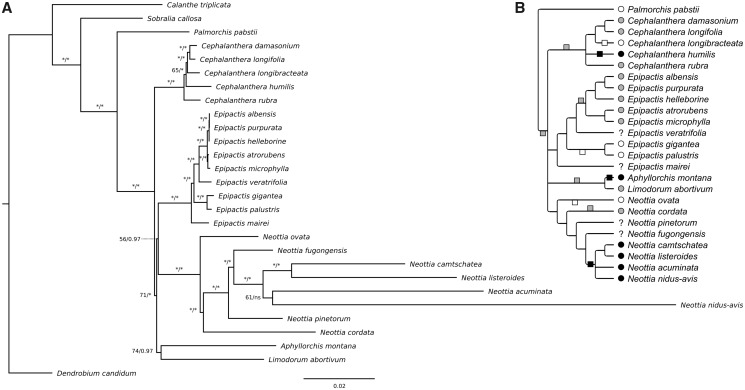
Fig. 1.
—(A) Phylogeny of Neottieae based on whole plastome analysis. Numbers above or to the left of branches represent bootstrap values (1,000 replicates) from ML analysis (left, stars indicate numbers above 95) and posterior probabilities from Bayesian inference (right, stars indicate probabilities above 0.98), ns means that the branch was not recovered in the Bayesian analysis. Scale bar: number of substitutions per site. (B) Two scenarios of mixotrophy and mycoheterotrophy evolution among Neottieae, that is, autotrophy (changes above the line) versus mixotrophy (changes below the line) of the Neottieae (excl. Palmorchis) ancestor. The tree is a consensus of the three analyses carried out on different sets of species and plastid DNA data (see supplementary fig. S1, Supplementary Material online, for other analyses). Nutrition type evolution is mapped considering the most parsimonious scenario in each case. Circles in front of species names indicate autotrophy (white), mixotrophy (gray), or mycoheterotrophy (black) and squares on the branches indicate shifts to these nutrition types in each scenario. Nutrition type evolution is mapped considering the most parsimonious scenario in each case. Boxes on the branches show changes occurring in both scenarios.

