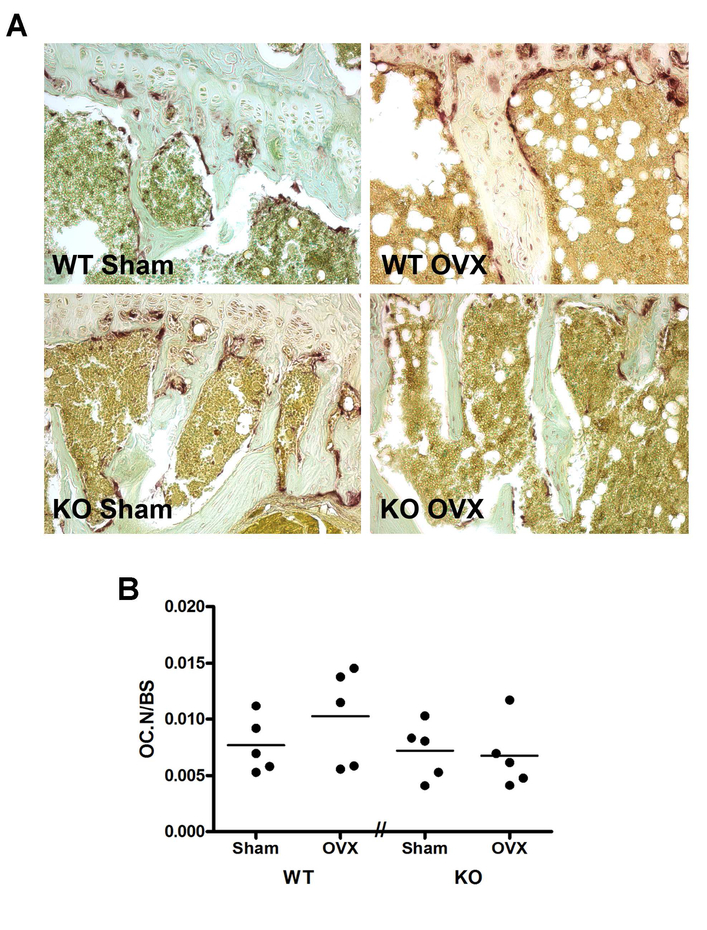
Figure 6. TRAP-positive osteoclast number tended to increase in control ovariectomized mice but not in ovariectomized PRKD1 conditional knockout mice.
Collected tibiae were fixed for paraffin embedding, sectioning and staining. (A) Representative micrographs from each group of mice are illustrated and show TRAP-positive osteoclasts in red. (B) The number of osteoclasts was determined as described in Methods. Each symbol represents an individual mouse with the lines representing the means of 4–5 mice per group.

