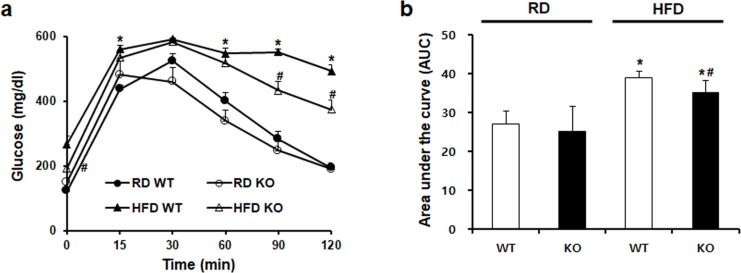
Fig 2. The effect CCR2 depletion on glucose tolerance.
(a) Glucose tolerance test (GTT) was performed after 8 weeks of HFD feeding and (b) calculated serum glucose area under the curve by intraperitoneal injection (1.0 g/kg). Increased glucose levels in HFD WT were remarkably decreased in HFD KO mice. RD WT, Regular diet wild type; RD KO, Regular diet CCR2 knockout; HFD WT, High-fat diet wild type; HFD KO, High-fat diet CCR2 knockout. *P < 0.05 compared to that in RD WT; #P < 0.05 compared to that in HFD WT.

